
Another week of ranging consolidation on Wall Street and for many other share indices

David Fuller's view The US stock market has had to contend with some
valuation expansion following the very good rally from early-June through mid-September,
at a time when 3Q corporate earnings are struggling to meet their reduced estimates
against the background of a sluggish global economy.
I have
discussed this ongoing reaction and ranging consolidation phase on a daily basis
in my Audios and wrote one of my longer pieces on the subject: The air is thinner
up here, on Tuesday
9th October (subscription logon required for the full item). Meanwhile,
Wall Street has the additional uncertainty of a close US Presidential Election,
plus the fiscal cliff. While most political commentators expect a temporary
bridging agreement to prevent an economic crisis, nerves may be tested by brinkmanship
within a deeply divided Congress.
So
far, Wall Street's action resembles a normal consolidation within a cyclical
bull market driven by QE, record low interest rates, some effective corporate
governance in recent years and for the most part, sufficient earnings to support
share indices during the 12th year of a secular valuation contraction cycle.
Nevertheless,
those earnings are starting to disappoint, as I mentioned in my opening paragraph
above. Consequently, fashionable shares which become very overextended relative
to their 200-day moving averages are being punished.
One of
the more dramatic examples of this was Chipotle
Mexican Grill, the fast expanding US-listed restaurant chain, which rose
for 17 consecutive weeks in a Type-1 ending (as taught at The Chart Seminar),
attracted the short sellers and is still weak although becoming somewhat overextended
relative to its now declining MA. I know CMG has many fans so watch for a short-covering
rally when it next shows some loss of downside momentum.
Google's
performance yesterday was a more important example as it is certainly one of
the most admired tech companies. Google rose for 12 consecutive weeks before
losing momentum last week and falling back sharply yesterday on earnings which
disappointed. The share will look more attractive as it moves closer to the
MA and that large underlying platform, although from an investment perspective
I would like to see some evidence of renewed support given that there is now
some concern over earnings.
Tech
talisman Apple (weekly & daily)
has been spectacular but students of behavioural analysis may recall all those
forecasts, not long ago, that it would reach $1000. Currently, it shows more
two-way activity, indicating an increase in supply relative to demand. In the
long history of mean reversion within very powerful trends, I cannot think of
many instances where the MA has not been at least tested and overshoots are
not uncommon. Currently, a sustained move back above $650 is the minimum required
to suggest that demand is regaining the upper hand.
Two other
tech giants, Intel and Microsoft,
are underperforming. INTC is becoming overextended to the downside relative
to its MA but damage has been done to the overall pattern. A loss of momentum
and / or an upward dynamic is needed to signal a temporary short-covering rally.
Microsoft is eroding support and needs an upward dynamic to check this drift.
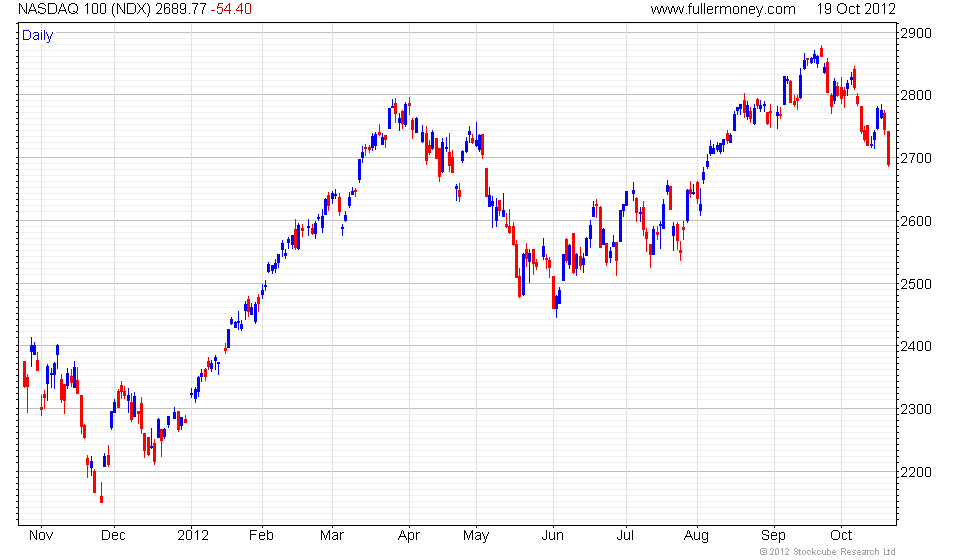
This
deterioration in tech leaders could be important because the Nasdaq 100 (weekly
& daily) Index has been a relative strength standout
over the last three and a half years. Although still within its overall upward
trend and above its MA, it failed to maintain the break above the March-April
high, indicating that supply has increased relative to demand. The daily graph
shows a resumption of the short-term downtrend today and a close above 2800
is currently needed to check this slide beyond a brief pause. Where leaders
go, many others follow.
This
year's star performing Nasdaq Biotechnology
Index has seen a normal, equal sized reaction so far but remains overextended.
A new closing high is required to postpone scope for further mean reversion.
The S&P
500 Index (weekly & daily)
has fallen back from the higher side of its narrow range today, increasing prospects
for a further test of underlying trading. A sustained break beneath 1400 would
indicate more of a correction, such as we saw following the March high, rather
than just a shallow reaction and somewhat longer ranging phase.
I think
Asia is likely to lead the next upward leg in stock markets, having lagged for
most of this year. The catalysts would be superior valuations relative to the
USA, better growth prospects, some monetary stimulus from China and perhaps
a revival in India if Prime Minister Singh's bold moves gather momentum.
Please
note - the charts above were drawn before Wall Street's close, S&P 500 excepted.