
A review of important ratios

When QE1 ended and the Fed withdrew from active participation, the market experienced a sharp pullback. This prompted the announcement of QE2. With the injection of additional capital, the market experienced another rally before giving way to a deeper reaction when it was eventually withdrawn. This prompted the Fed to embark on an even larger program which is only now drawing to a close and market volatility has increased. The 2009 and 2011 spikes on the below chart of the VIX coincide with times when QE programs have been withdrawn.

Over the last few days Fed governors have been attempting to assuage market fears by saying that they will not rush to raise interest rates, that they are vigilant for the impact overseas economic weakness might have on the USA and that they may be prepared to make additional asset purchases. This would suggest that the Fed is not yet willing to impose cold turkey on a market addicted to liquidity. However since this is already a mature cycle, any additional QE program would need to be even larger than the last in order to achieve the same results. In the intervening period, between now and when such a program might be announced, the risk of additional deleveraging is non-trivial.
Veteran subscribers will often have heard us say that market leaders tend to lead in both directions and leaders lead for a reason. In the period from the 2009, the rally that occurred was fuelled by liquidity. Small caps thrive in an abundant liquidity environment. Companies gained access to record low nominal costs of capital, refinanced more expensive debt. They have also bought back $3.5 trillion of their own shares since 2010. I thought it would be instructive to look at some of the ratios for these sectors to observe how they are performing now.
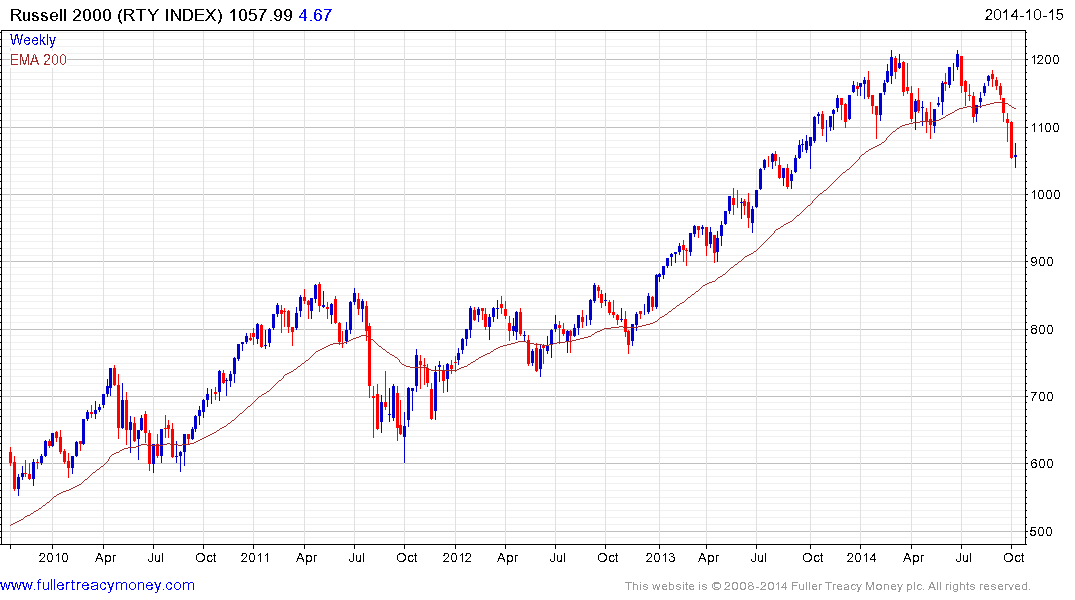
The Russell 2000 lost momentum following an impressively consistent 2-year advance and completed a Type-3 top two weeks ago. While some short-term steadying is a possibility, this action represents major trend deterioration and a sustained move above 1130 is the minimum required to question medium-term supply dominance.
The PKW Buyback Achievers Index was among the greatest beneficiaries of Fed largess as companies spent record sums on buying back their own stock. However, as the price of a share rises the amount of money set aside to buy back shares needs to increase commensurately in order to achieve the same results. Simply put, the higher the price the less bang for your buck. The ETF has been underperforming the S&P 500 since late last year and encountered resistance three weeks ago in the region of the 200-day MA.
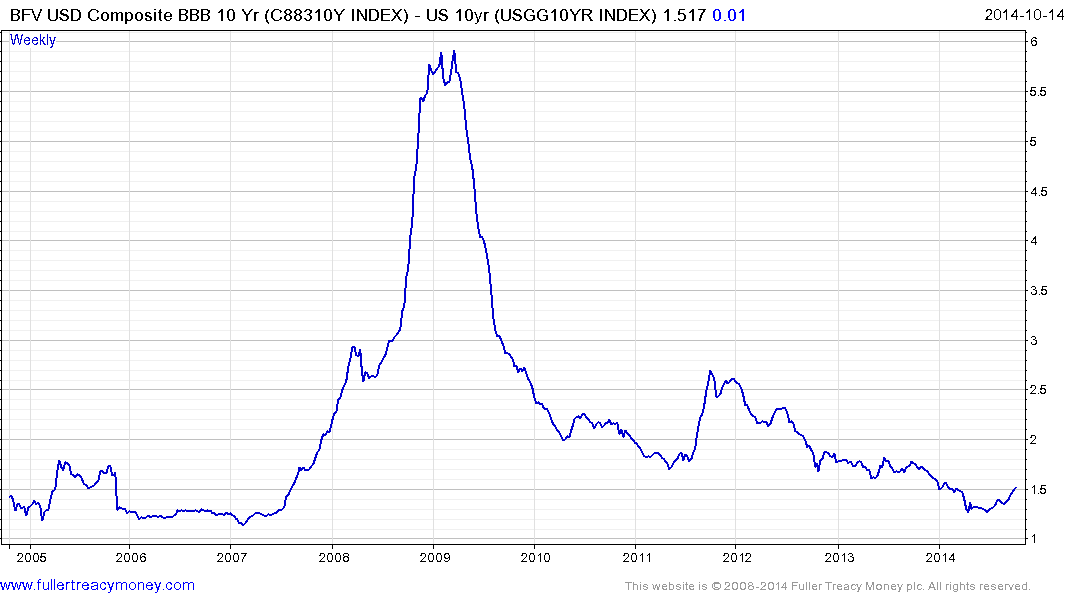
BBB corporate bonds spreads tested the 125 basis points area in July. While still historically tight, it continues to expand. This is despite the fact the bond yields compressed violently today as investors seek a safe haven.
The above charts represent some of the greatest beneficiaries of easy monetary policy. The fact they are underperforming suggests the conditions on which they thrived are changing. Caution is warranted until evidence of support building is apparent. Major indices need to at least hold today’s lows in order to conclude more than temporary steadying.
Back to top