
Secular Themes Review December 3rd 2021

Secular Themes Review December 3rd 2021
A year ago, I began a series of reviews of longer-term themes which will be updated going forward on the first Monday every month. The last was on October 1st. These reviews can be found via the search bar using the term “Secular Themes Review”.
One of the most basic truisms in the financial markets is it is easier to make money in a bull market. The bull market that began in late 2008 and early 2009 has been liquidity fuelled. That was not obvious to everyone a decade ago but now everyone gets the message. Money printing inflates asset prices. As long as central banks are printing, we will have bull markets and the most speculative assets will perform best.
.png)
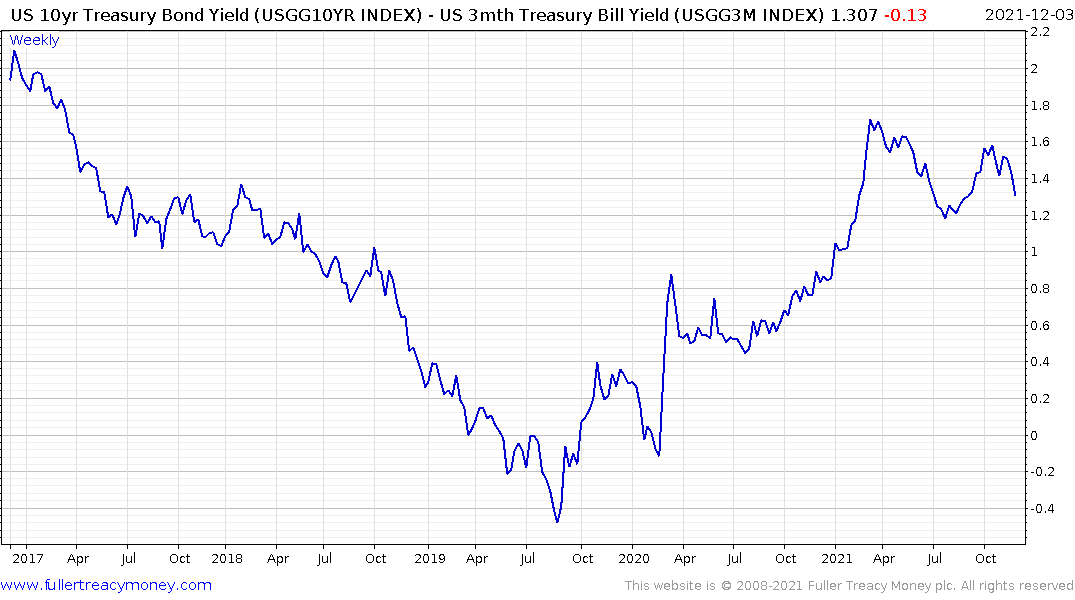
The yield curve spread has peaked. That’s true whether we look at the 10-year-2-year or the 10-year-3-month. So, what does that mean?
Financial conditions are going to get tighter and they will continue to tighten until there is a recession or central banks change course.
In a normal cycle the yield curve becomes inverted 9 to 18 months before a recession. The Federal Reserve keeps tightening until something breaks, then backpedals quickly. They used to start by lopping several hundred basis points off the headline short-term interest rate. That was usually in response to significant stock market weakness. Major indices tended to bottom when the spread peaks and begins to turn lower, like in 2009/10.
As central banks normalise and prepare for the next problem, the spread contracts and asset prices did well because investors concluded the Fed was combating inflation by raising rates and that was good for the economy. Eventually, the economy shows signs of overheating, the central bank persists in tightening, an inverted yield curve is present and the countdown to the next recession begins again.
This is not a normal cycle. The yield curve spread became inverted in 2019. That lit the fuse on the next recession and valuations were already high. The seizing up of the high yield market, then the repo market, were raising the potential for a shock in 2020 before the pandemic hit.
The Federal Reserve has been given a lot of credit for acting with alacrity to pull out all the stops in March 2020. That institutional transformation was possible because they were already in loosening mode before the pandemic. Since then, everything has accelerated.
The challenge today is the spread is peaking at substantially lower levels than over the last thirty years. That reflects the low nominal rate which pre-dated the pandemic and the mathematical impossibility of creating a 300-point spread without going deeply into negative territory.
For central banks like the ECB and BoJ that failed to raise rates in the last cycle, their spreads remain close to zero. The ECB is already in negative territory and relies on quantitative easing programs to effect policy.
The low starting level suggests this cycle will be shorter than the last. Of course, the last one was the longest in history so that’s not an ambitious forecast. The one thing that is obvious is an inverted yield curve can only be avoided if the Federal reserve does not raise rates by more than 100-basis points in this cycle.
The total assets of central banks chart sits at $32.5 trillion, and the pace of its ascent has moderated significantly over the last few months. It is still rising but times when the chart has paused have coincided with stock markets ranging more than trending.
Financial conditions charts are bottoming.
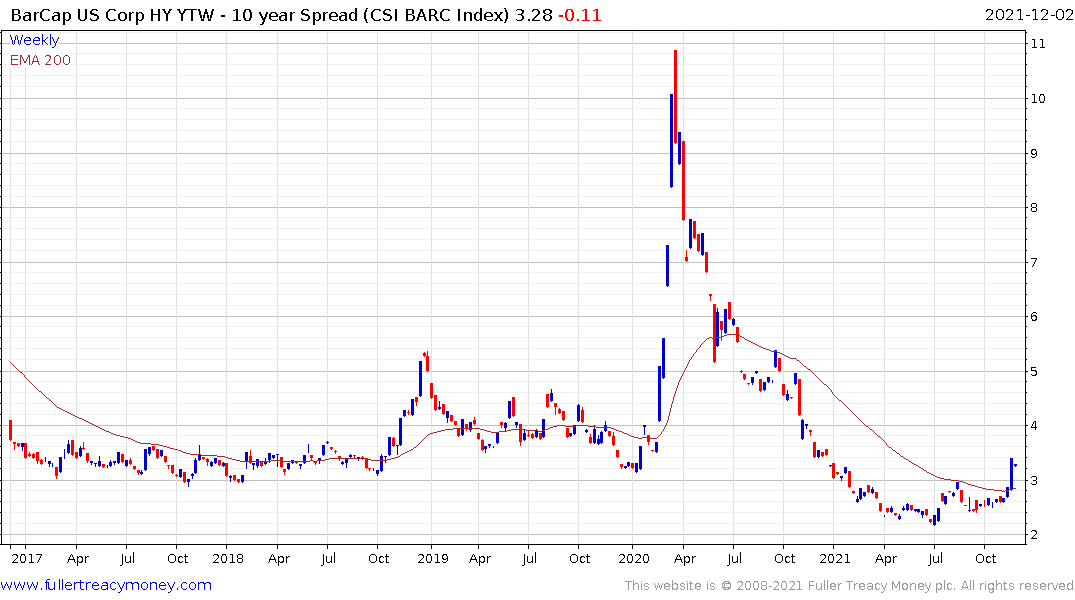
High yield corporate spreads have bottomed.
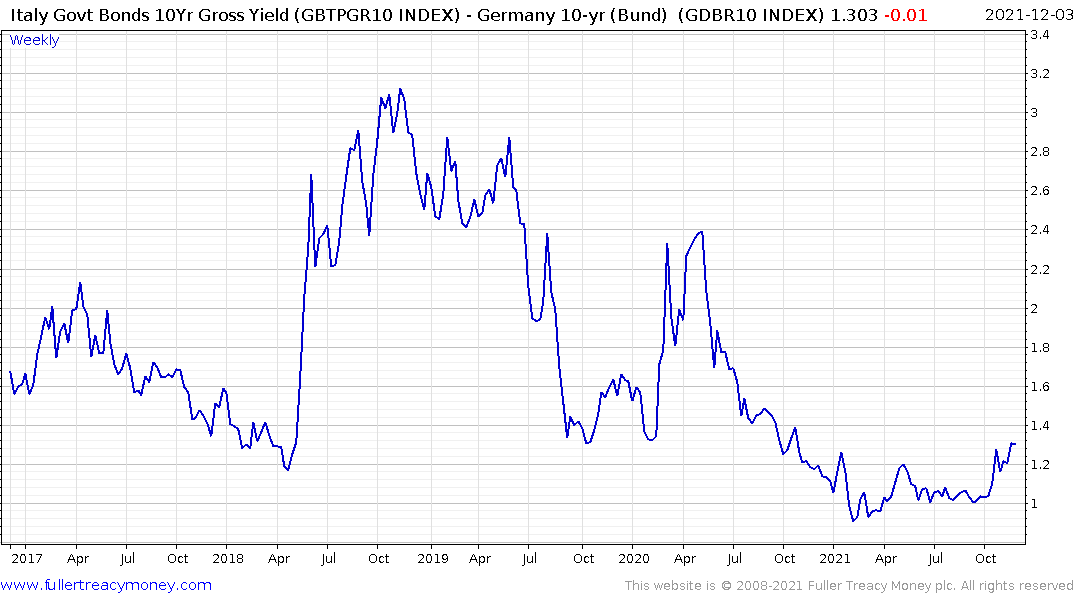 High yield developed market sovereign spreads, like Italy’s, have also started to rise.
China’s high yield corporate bond Index also continues to trend lower.
The most interest rate sensitive portions of the market are underperforming. For unprofitable companies with dim prospects of survival; without access to cheap abundant liquidity, even a modest tightening of credit conditions represents existential threats.
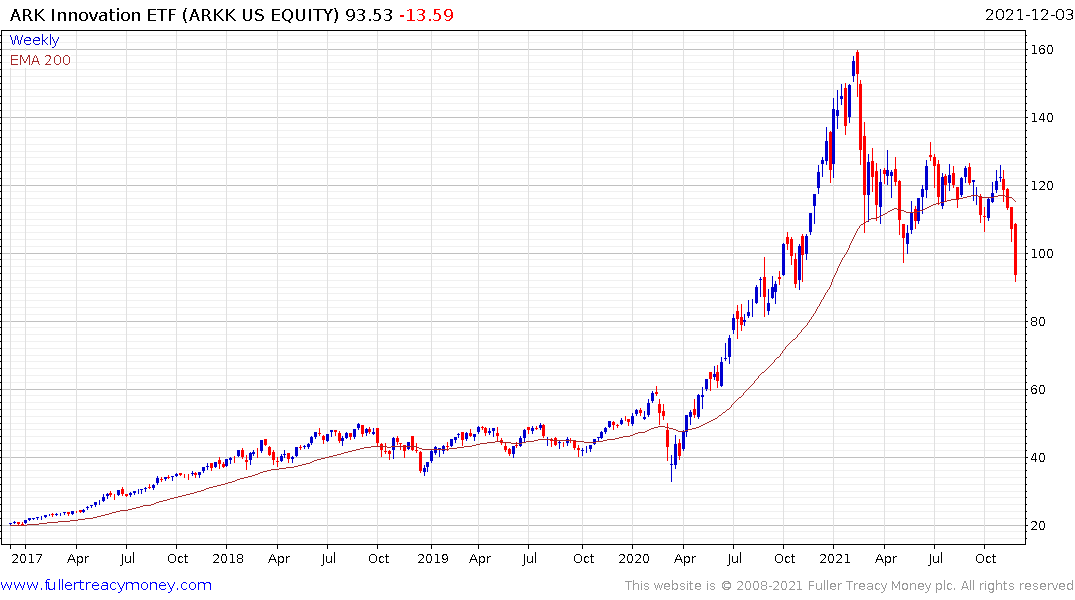
The ARK Innovation ETF broke downwards today. The fund has classic Type-1 acceleration top characteristics, a Type-2 massive reaction against the prevailing trend, and an almost yearlong process of righthand extension which has now been resolved on the downside.
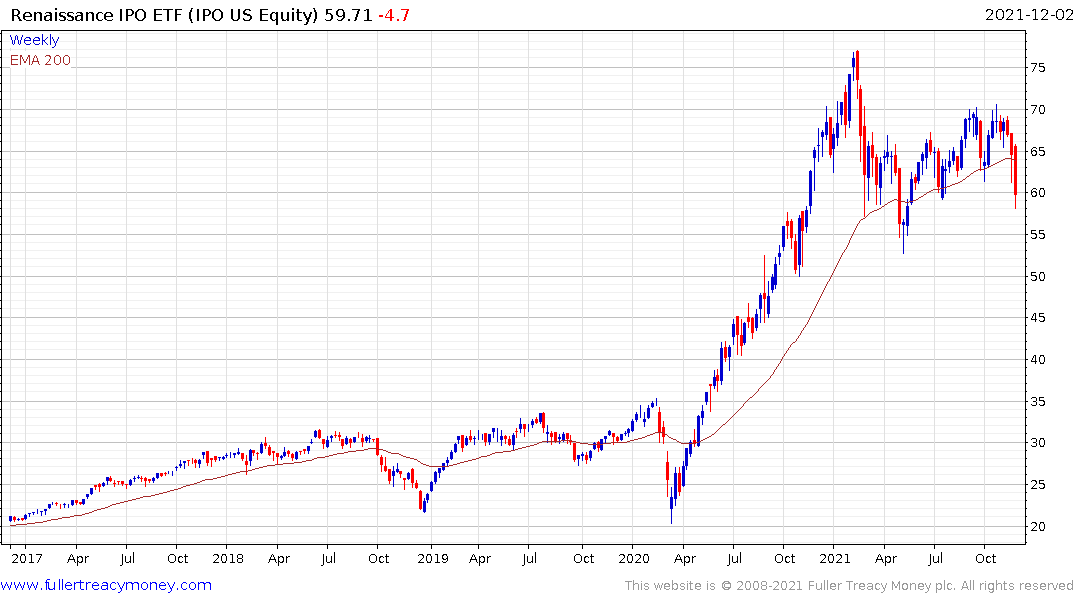
The Renaissance IPO ETF has similar Type-1/2 top formation characteristics.
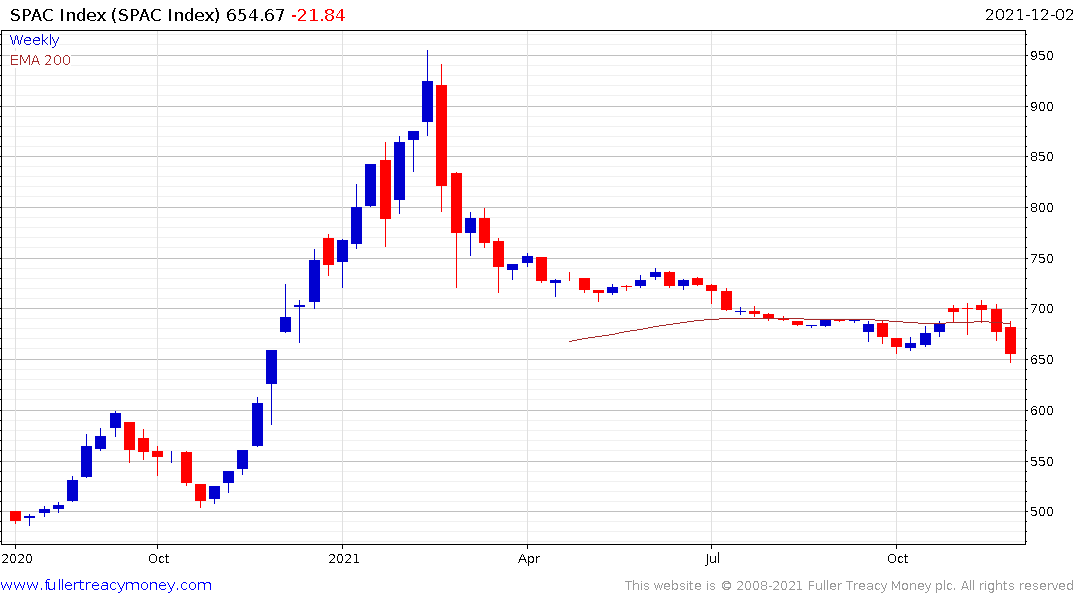 The SPAC Index is also breaking lower.
The underperformance of the financial services sector is also notable. Amazon’s attempt to squeeze Visa’s margins is one cause but the whole sector has sold off. Global Payments is the worst performing share on the S&P500 this year. A disparate group like Mastercard, PayPal, Sofi, Square, LendingTree Rocket Cos. and others are trending lower.
.png) The major banks like JPMorgan no longer focus on writing mortgages and personal/consumer banking is a bit part of their overall business. The regional banks tend to only focus on consumer banking. Insurance companies have also been resilient. They all share commonality and are outperforming the newer financials.
The major banks like JPMorgan no longer focus on writing mortgages and personal/consumer banking is a bit part of their overall business. The regional banks tend to only focus on consumer banking. Insurance companies have also been resilient. They all share commonality and are outperforming the newer financials.
This divergence of fortunes begs the question whether the new finance sector, pioneered by the cryptocurrency sector, built on by the buy-now-pay-later group, and embellished by NFTs and the metaverse are in the process of a major correction.
The biggest challenge with this market is so many of the pockets of leverage moving the market are in difficult to monitor locations. In 2006/7 the underperformance of the banking sector was evident. Most people did not understand that the subprime issue had the potential to bring down the financial sector but the evidence was available. I do wonder whether the breakdowns in the credit card and new finance sector is reflecting a wider problem within the financial system that is not readily apparent.
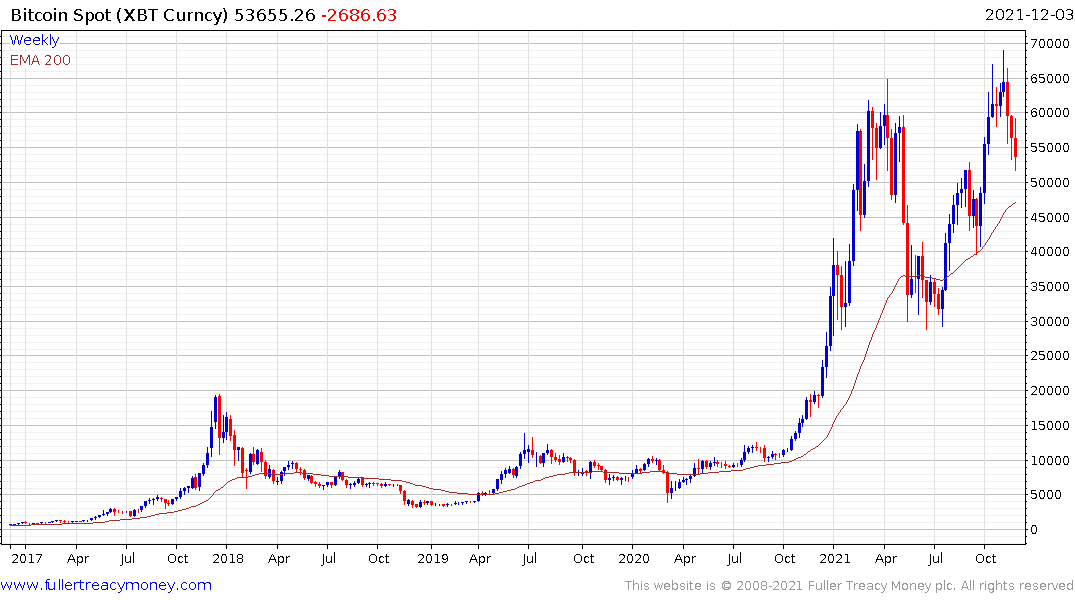
Bitcoin was created in response to the monetary debasement which followed the credit crisis. It has thrived more than any other asset during the liquidity-fuelled bull market. The price failed to sustain the breakout to new highs in November and climaxed with a downside key day reversal. That suggests it will at least come back down and test the $50000 level.
So far Ethereum has retained relative strength and continues to hold its break out.
The big question for the sector is whether it can continue to sustain inward flows when leverage is being squeezed everywhere else.
The relative performance of the FANGMANT (Facebook, Apple, Netflix, Google, Microsoft, Amazon, NVidia and Tesla) remains impressive and hit an incremental new high this week. These companies are the heavyweights in the tech scene but also the major indices. Their Achilles’ heel is in the fact they are often suppliers of services to the smaller upstart companies.
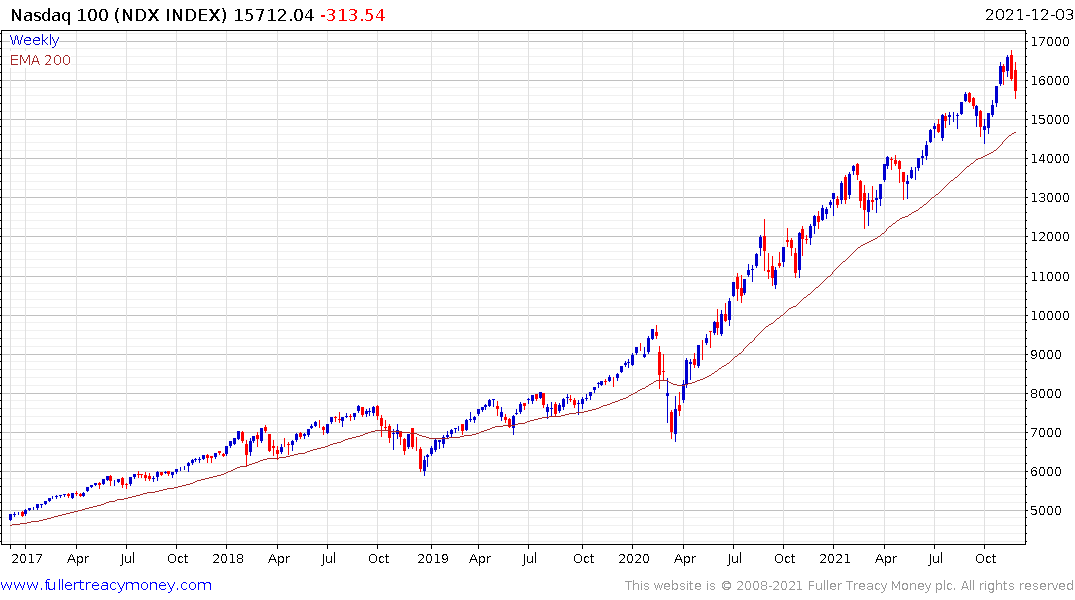 The mega-caps might be falling slower than the Nasdaq but both are susceptible to additional weakness. The Nasdaq-100 posted a downside weekly key reversal last week and followed through on the downside this week. That confirms at least a short-term and potentially a medium-term peak. The hallmark of the uptrend over the last year has been the sequence of ranges one above another. That means if the trend up from the March 2020 lows is to be remain consistent, the Index needs to bounce now.
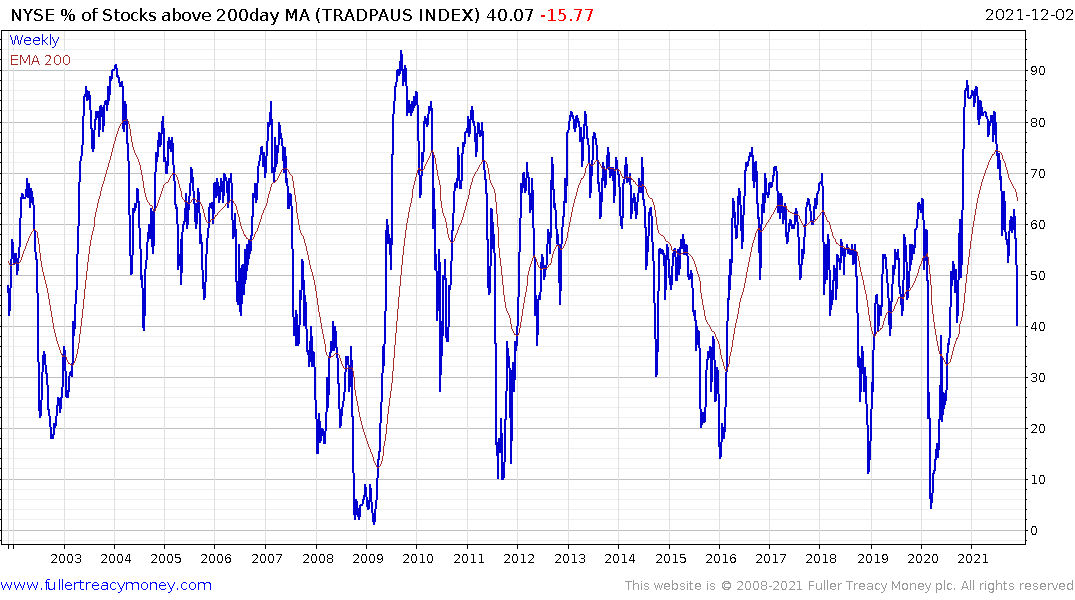
The number of shares trading below their 200-day MAs has fallen aggressively over the last few weeks. That’s to be expected following the ferocity of the post pandemic panic bounce. The same thing happened in 2010 following the big GFC rebound. Stock markets had a difficult time for a year as the first QE program wound down.
The difference on this occasion is valuations are much higher than a decade ago. The significant underperformance of the most interest rate sensitive portions of the market is a warning that Jay Powell’s willingness to dispense with the “transitory” inflation phrase and potentially accelerate tapering is not being taken lightly be investors.
.png)
The significant compression in the 10-year suggests bond investors are a lot more worried about deflation than inflation. That’s might be counterintuitive for anyone listening to the financial media which have been filled with inflationary commentary for the last few months. However, the reality is central banks are going to have a very difficult time raising rates.
Many of the issues that contributed to inflation were already likely to moderate next year. However, the new COVID variant appears to be much more transmissible than its predecessors and it remains unknown whether it is likely to incur serious symptoms. Meanwhile the range of vaccines and treatments continues to expend which suggests the ability of the virus to continue to have a negative effect on the global economy is waning. It would be tempting to lay the recent selling pressure at the feet of the Omicron variant but interest rates are more important.
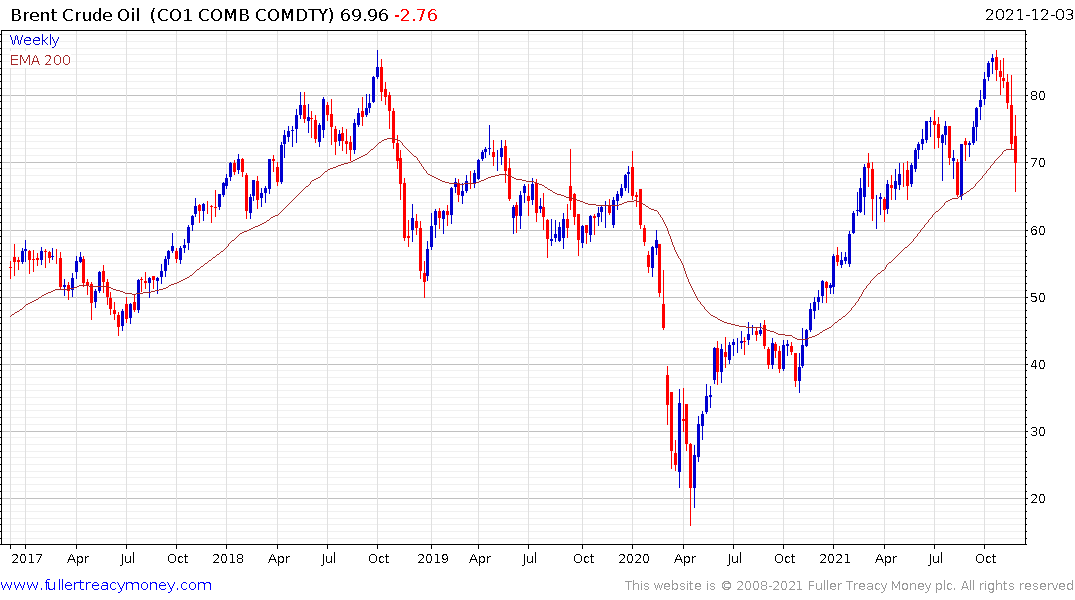
Crude Oil’s swift decline over the last couple of weeks is just one more example of how deflationary pressures are rising in the global economy as the tailwind of monetary accommodation wanes.
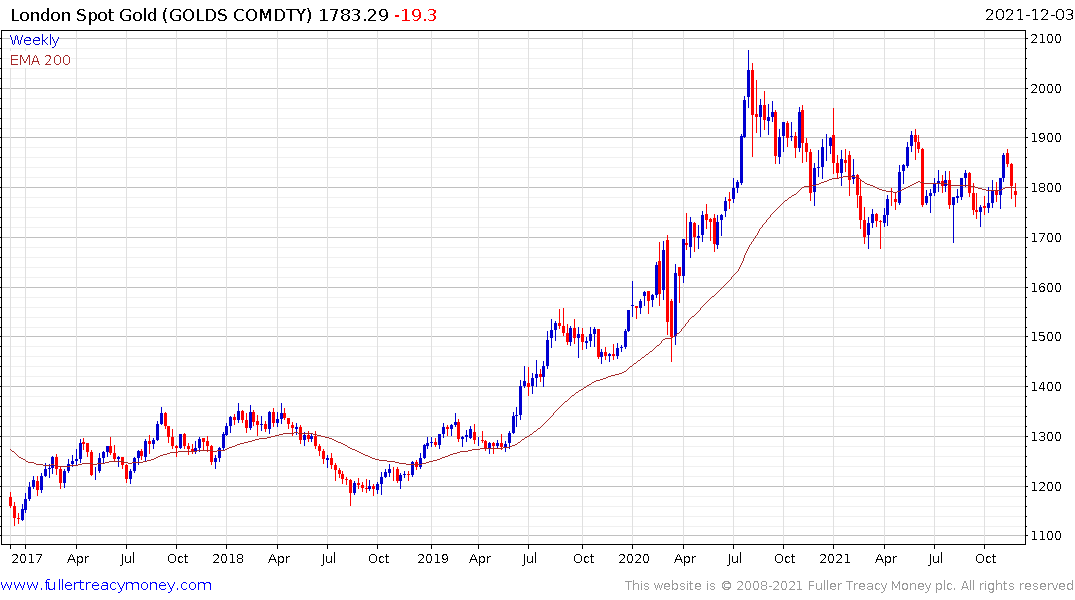
Gold continues to build support and could easily attract greater attention as a safe-haven during a broader stock market decline.
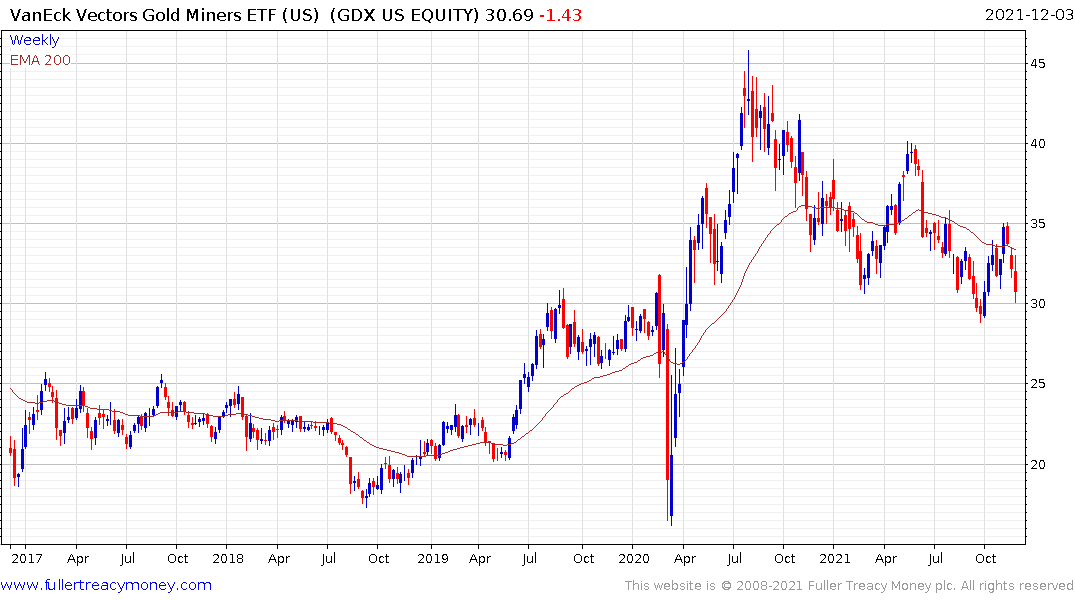
The Gold Miners ETF has returned to test the $30 area and is beginning to build support amid a short-term oversold condition.
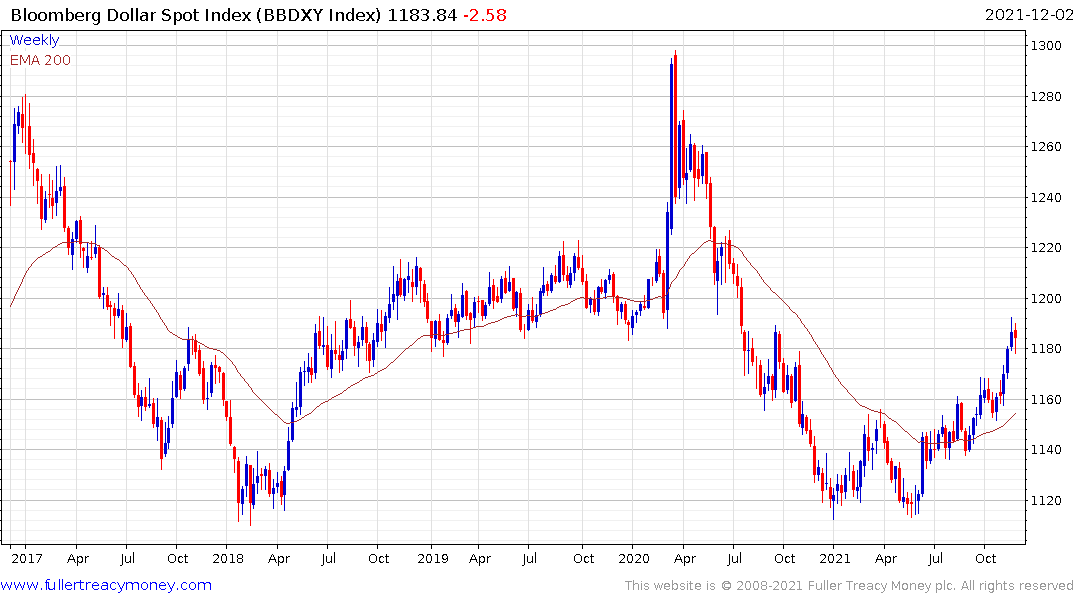
The Bloomberg Dollar Index remains in a consistent uptrend which also suggests safe-haven demand.
The biggest wildcard is China. Asset prices and chart patterns are offering mixed signals. The country is notoriously difficult to get reliable data on. The big question is what they are going to do about the property sector. Some measures have been taken to improve liquidity but bond prices continue to trend lower. The credit impulse is at a point where it should begin to turn upwards and banks are steadying so there is potential that the emerging property market bond crisis can be contained. This more than any other event needs to be monitored. 20 years ago, China was a bit player in the world, now it is a major contender. Chinese assets occupy significant weightings in the portfolios of many international investors.
If this were happening in isolation it might be less of a worry but it is only one of a range of potential flash points for investors with China. It is looking increasingly likely that the major stocks listed in the USA will either be forced to delist of open their accounts to GAAP standards. Either outcome is less than desirable for companies that have thrived in the grey area of international regulation. Stocks like Alibaba extended declines over the last few weeks and are looking very oversold at present.
India remains a beneficiary of rising geopolitical tensions with China. It is being supported as a counterweight to China’s extraterritorial ambitions in the region.
Every bull market is interspersed with occasional corrections. The major indices are all at positions where support needs to come back in a hurry if trends are to remain consistent. If they fail, it would be reasonable to expect deeper, lengthier corrections than we have seen in the last few years. In 2018 it took a 20% pullback on the S&P500 to deter the Fed from persisting with quantitative tightening. It remains to be seen how much of a correction will be required to contain their appetite for tightening monetary policy this time.
Back to top