
Secular Themes Review April 1st 2021

On November 24th I began a series of reviews of longer-term themes which will be updated on the first Friday of every month going forward. The last was on March 5th. These reviews can be found via the search bar using the term “Secular Themes Review”.
The pandemic has been an accelerant. The full ramifications of what that means are becoming increasingly clear.
The pandemic took trends that have been in evidence for a while and exaggerated them. At the same time, it introduced new challenges which require new solutions.
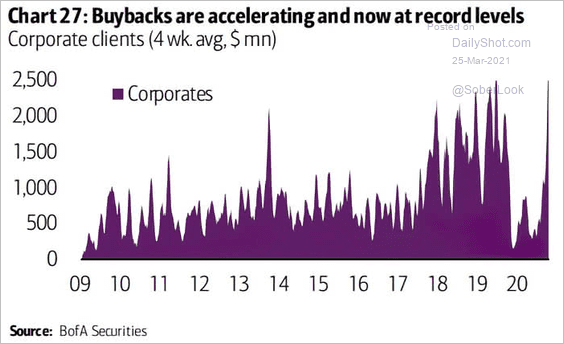
Corporations operating without the safety net of cash on the balance sheet has been a feature of the markets for decades too. They continue to be bailed out when they get into trouble. There is no evidence that the trend of using all available means to buy back shares has ended. In fact, buybacks are back at pre-pandemic levels. Companies were touting “resiliency” last summer. It appears to have been just talk. Buybacks represent a powerful tailwind for stock markets that were absent for much of 2020 but are now back in force.
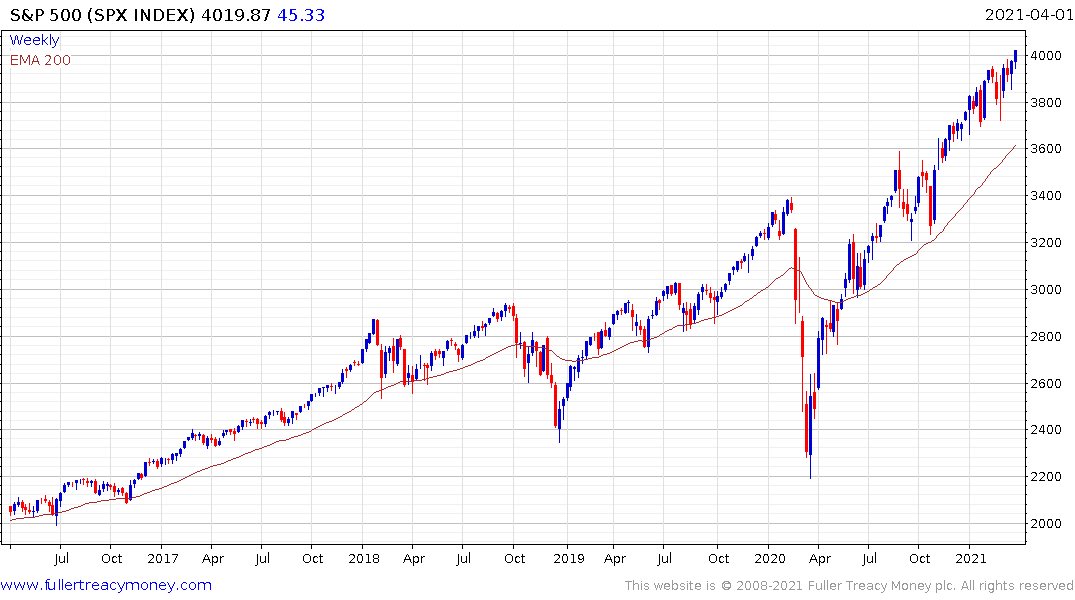
The S&P500 broke out another new all-time high this week and remains in a consistent uptrend.
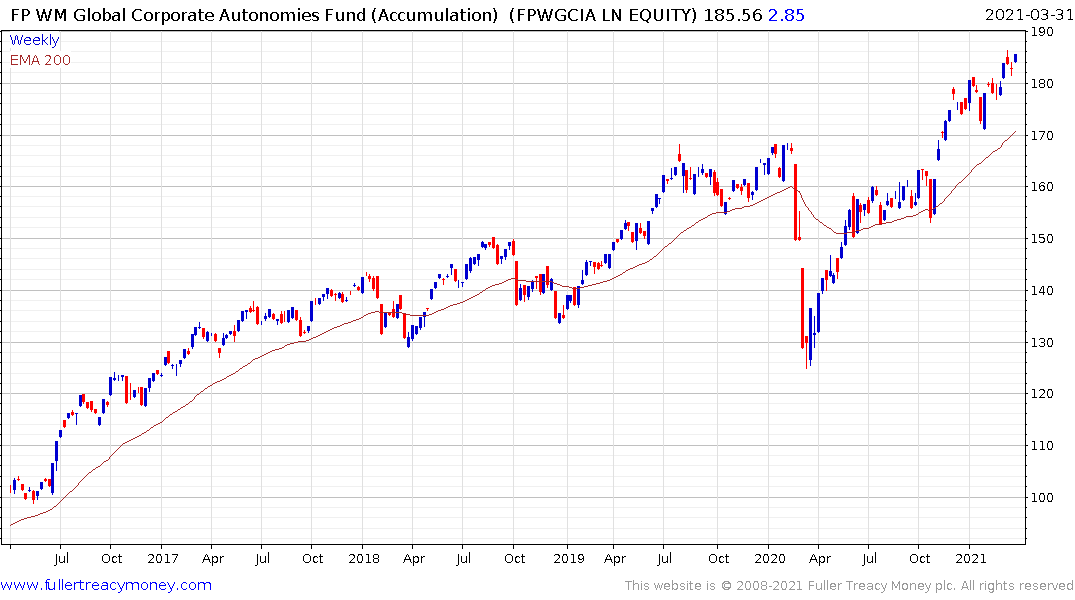
The Autonomies Fund is also trending higher and the Dow Jones Industrials Average has been leading the wider market higher.
The cloud computing/software-as-a-service sector fared particularly well because the lockdowns pulled forward sales from years in the future. That’s very similar to the panic buying that occurred ahead of Y2K back in the 1990s. It seems clear that 2020 growth rates will be impossible to repeat in 2021.
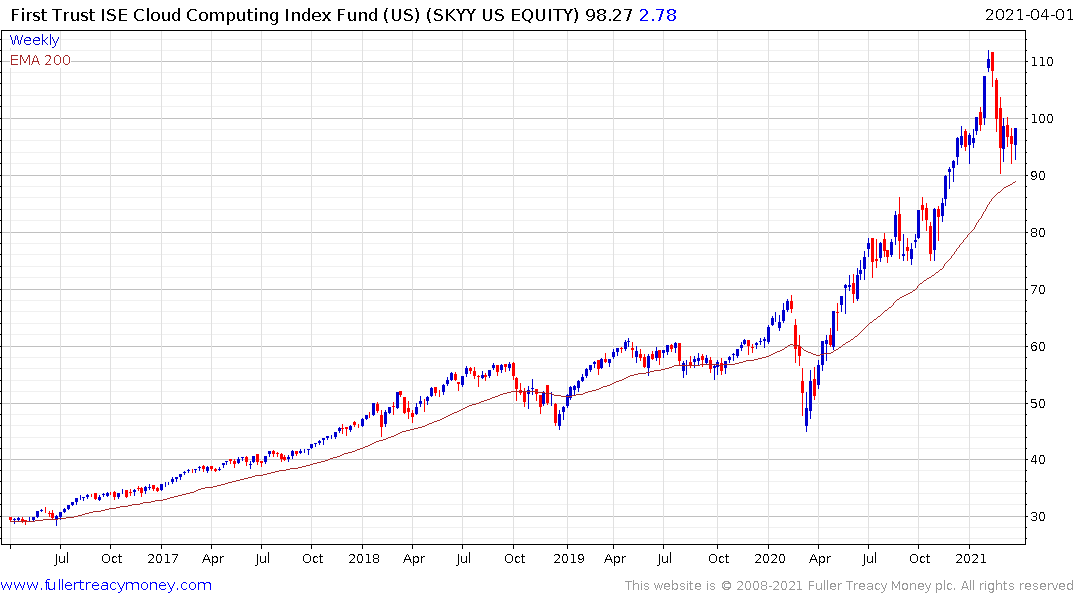
The First Trust Cloud Computing ETF eased back over the last month to unwind an over extension relative to the trend mean and rebounded over the last week to confirm near-term support.
The demise of brick-and-mortar retail had been underway for decades and the pandemic accelerated that trend. Accelerations of pre-existing trends are ending signals so it is reasonable to conclude survivors have staying power and will prosper in future. Additionally, the pandemic has made everyone much more aware that social interaction is essential for everyone’s wellbeing. Markets have been social places for as long as humans have been urbanised. That’s not going to change because of technology.
As businesses get back to work, I’ve seen more and more people behave as if they have post traumatic stress. More than a few people freak out when they think people are too close to them. That kind of fear does not dissipate overnight and rational argument will not have an effect on it. It represents a lucrative market for the pharmaceuticals industry who have been promoting psychiatric drugs as lucrative markets from other chronic conditions face greater competition.
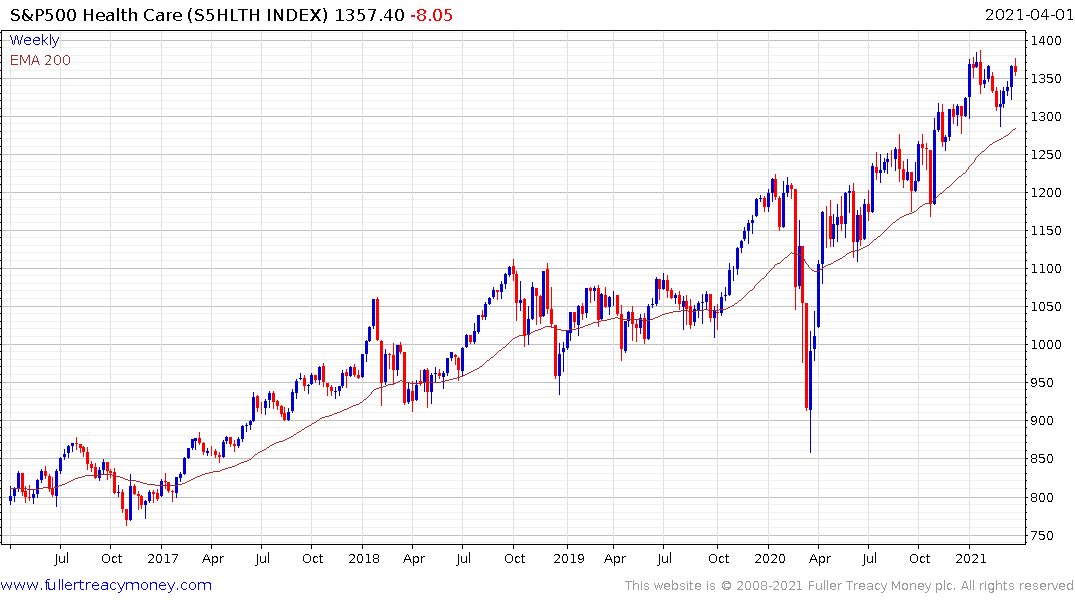
The S&P500 Healthcare Index continues to trend higher in a reasonably consistent manner.
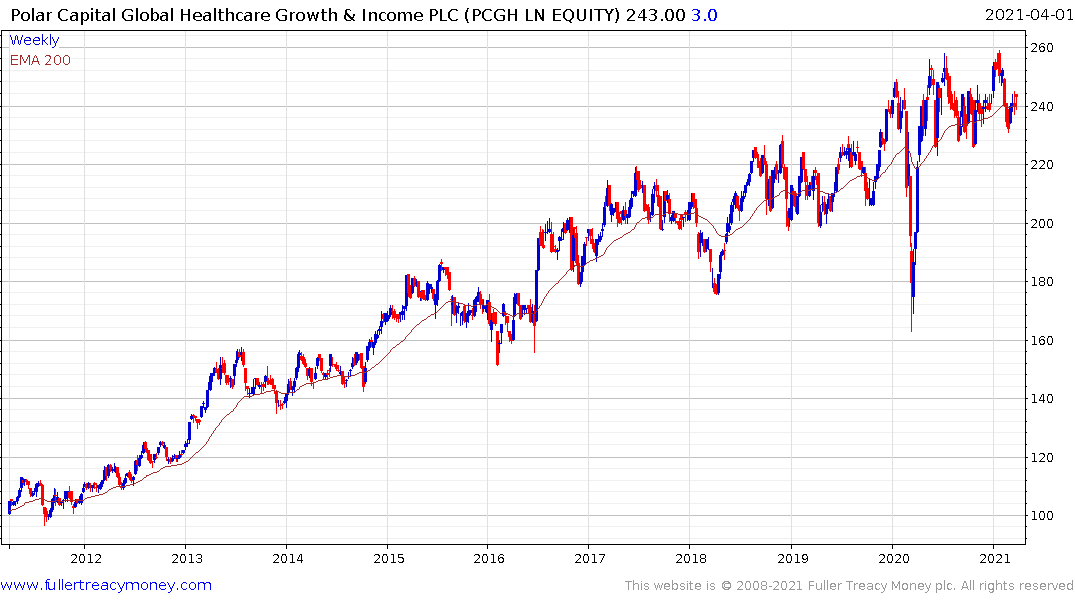
The Polar Capital Global Healthcare Trust has a reasonably similar pattern.
The pandemic also accelerated the commercialization of genetic solutions to new and existing medical needed. The speed with which large numbers of new vaccine candidates have been created is a massive proof of concept case for the biotechnology sector.
Personalised medicine and genetic solutions were promised during the big bull market of the 1990s. More than twenty years later they are closer to commercial reality than ever. The scope for big data and artificial intelligence to transform the healthcare sector represents a vast growth opportunity over the next decade.
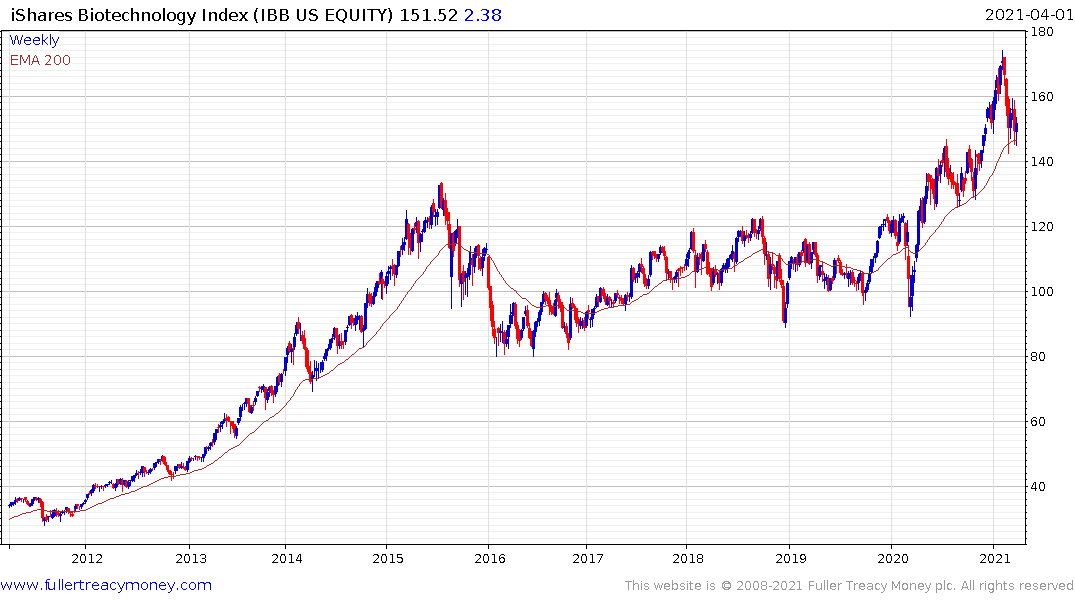
The iShares Biotechnology ETF is firming from the region of the trend mean.
So is the UK listed iShares Healthcare Innovations ETF.
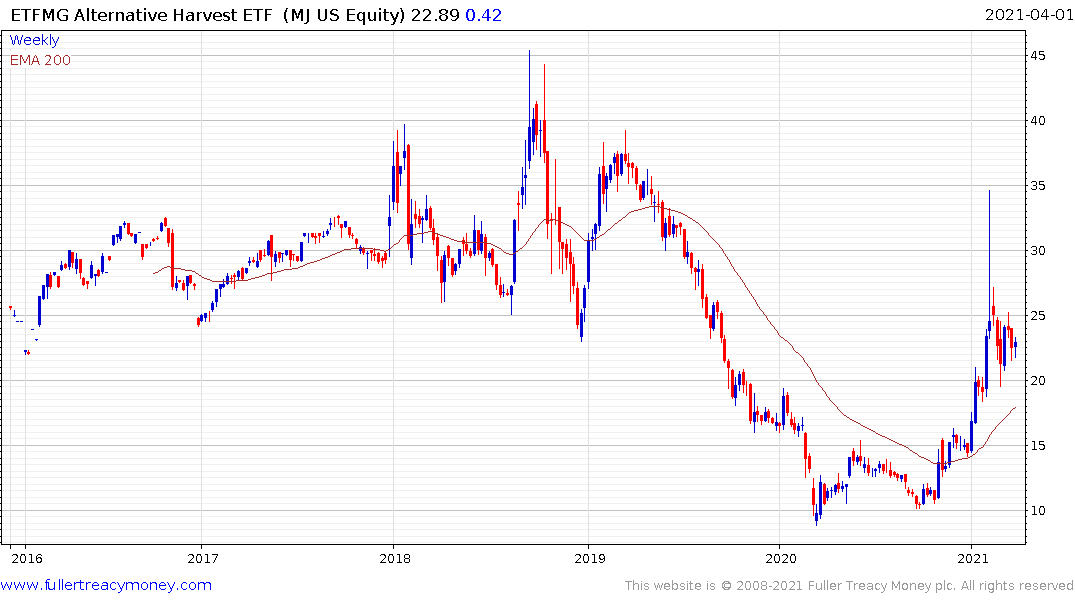
The Alternative Harvest ETF continues to consolidate following its impressive breakout in 2020.
The pandemic sped up the migration of millennials from the cities to the suburbs. It also sped up the plans of retirees to sell up and move to less expensive areas. It’s safe to say the pandemic crystalised the views of anyone who was on the fence about moving. That has contributed to property prices increasing substantially over the last year all over the world.
Stories of highly competitive bidding wars are cropping up everywhere from Canada to Australia, to New Zealand, the UK and USA. In some of these markets this represents a clear acceleration of trends that have been underway for decades.
At present estimates for values based on comparative historical sales are lagging the reality of bidding wars. At some stage this year, the estimates of value will have to increase. Since the imputed value of rent is the primary input for inflationary measure, that implies inflation is likely to pop on the upside later this year.
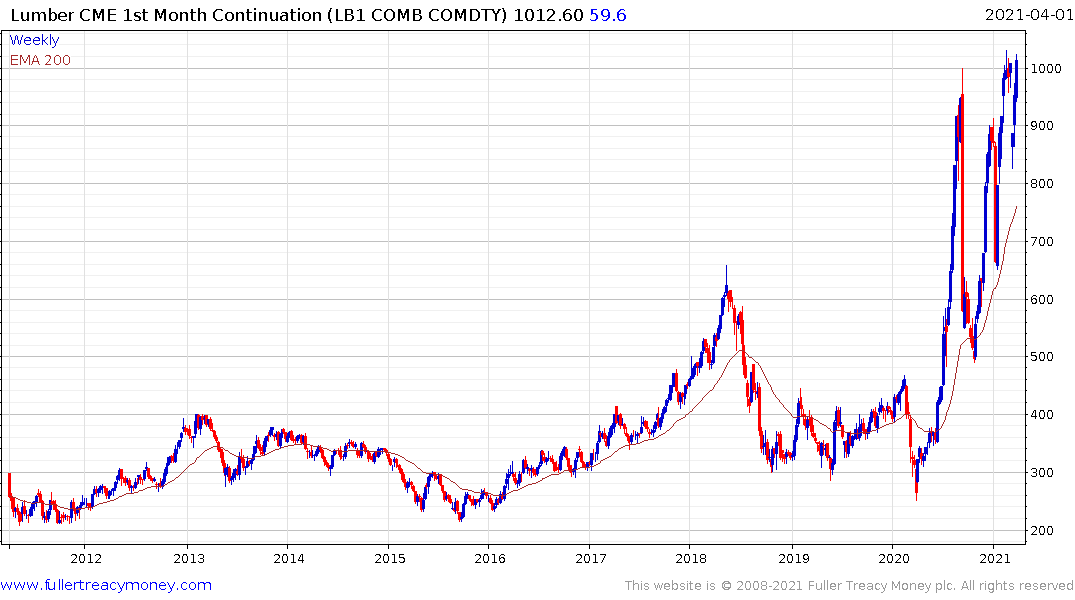
Lumber prices are also at all-time highs and took out the $1000 level this week. This has been a profound change and increases the cost of production for North American construction. That will potentially result in a slower supply response and that’s particularly true as bond yields continue to rise.
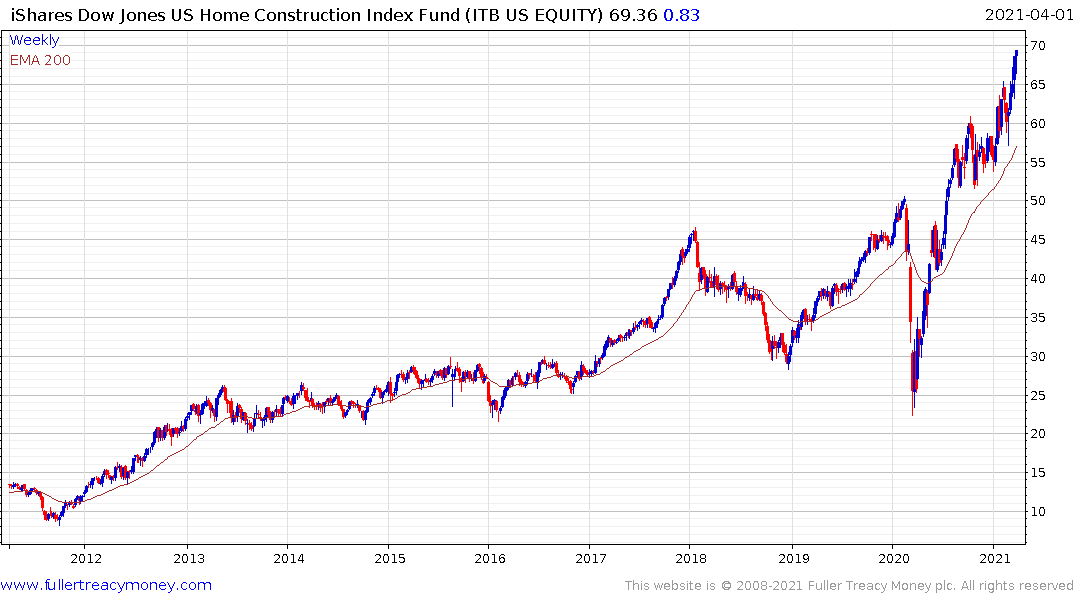
The iShares Home Construction ETF remains in a clear uptrend but is currently overextended relative to the trend mean.
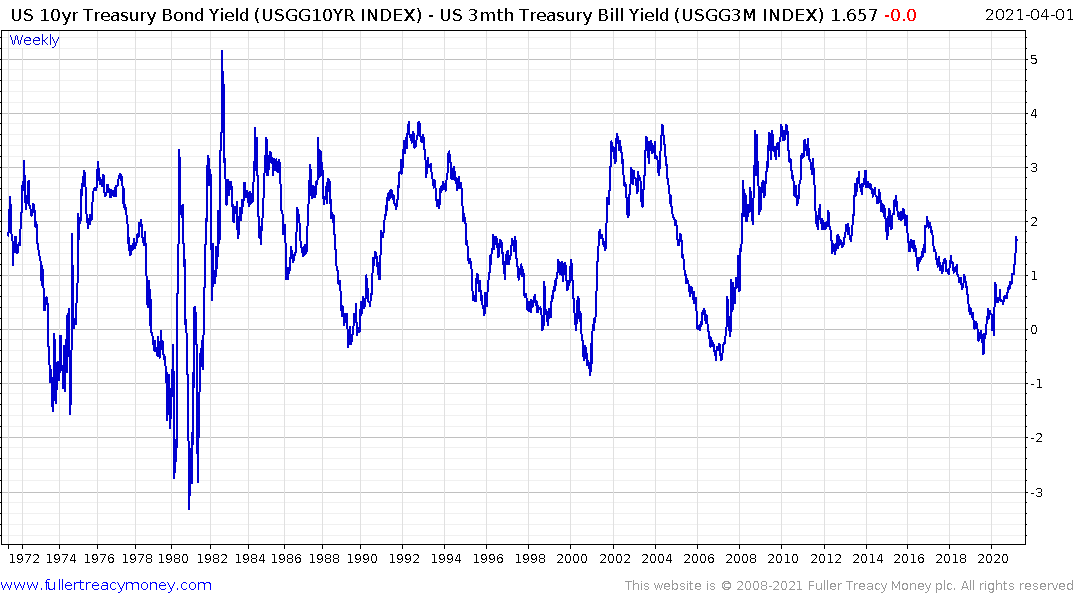
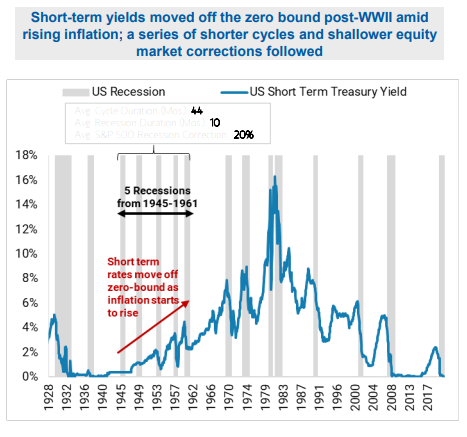
Perhaps the most profound acceleration that arose from the pandemic is in the economic cycle. Historically, the 10-year - 3-month yield curve spread offers the longest lead indicator for a future recession. It first became inverted in March 2019 and initiated the countdown to a recession.
The typical pattern once the yield curve is inverted is the stock market continues to rally. That can last for anything between 6 to 18 months and investors forget about the signal. It is when the yield curve begins to trade back up into positive territory that investors take flight and prices fall. Central banks are usually way behind the curve in lowering interest rates. By the time they get the message, exaggerated moves are required and the curve tops out around 400 basis points. That is usually when stock markets bottom.
On this occasion, the Federal Reserve in particular was early in acting. Because they did not have a wide margin of interest rates to cut, a large number of additional assistance programs were enacted and the quantity of money provided was well in excess of what we have seen during past recessions. That resulted in a short, but very sharp, recession and a very swift recovery.
This is quite different to anything we have seen in the last forty years. It coincides with an additional acute change in how crises are responded to. Fiscal stimulus is now the leading form of assistance and it is being facilitated by monetary largesse. The financial sector has also been co-opted through the provision of PPP loans. That reduces the risk in the sector and increases their margins.
The KBW Nasdaq Global Bank Index is trending back towards the upper side of its 13-year base formation while the iShares U.S. Broker-Dealers & Securities Exchange ETF is clearly outperforming.
Focusing on fiscal assistance coincides with the Federal Reserve giving up on predicting inflation. They have finally concluded that their estimates for inflation have been woefully optimistic for more than a decade. Their solution is to give up on predicting inflation and instead wait for evidence that it is trending higher.
This is a profound change and suggests central banks are willing to do whatever is necessary to achieve inflation. Morgan Stanley produced the above graphic to illustrate their hunch that future economic cycles will be shorter than what we have been accustomed to over the last forty years. It implies that the interest rates are going to trend higher in a jerky manner over the next twenty years. It also implies that the pace of economic expansion will be much swifter than that implied by the “secular stagnation” of the last twenty year and that the recessions will continue to be short and sharp.
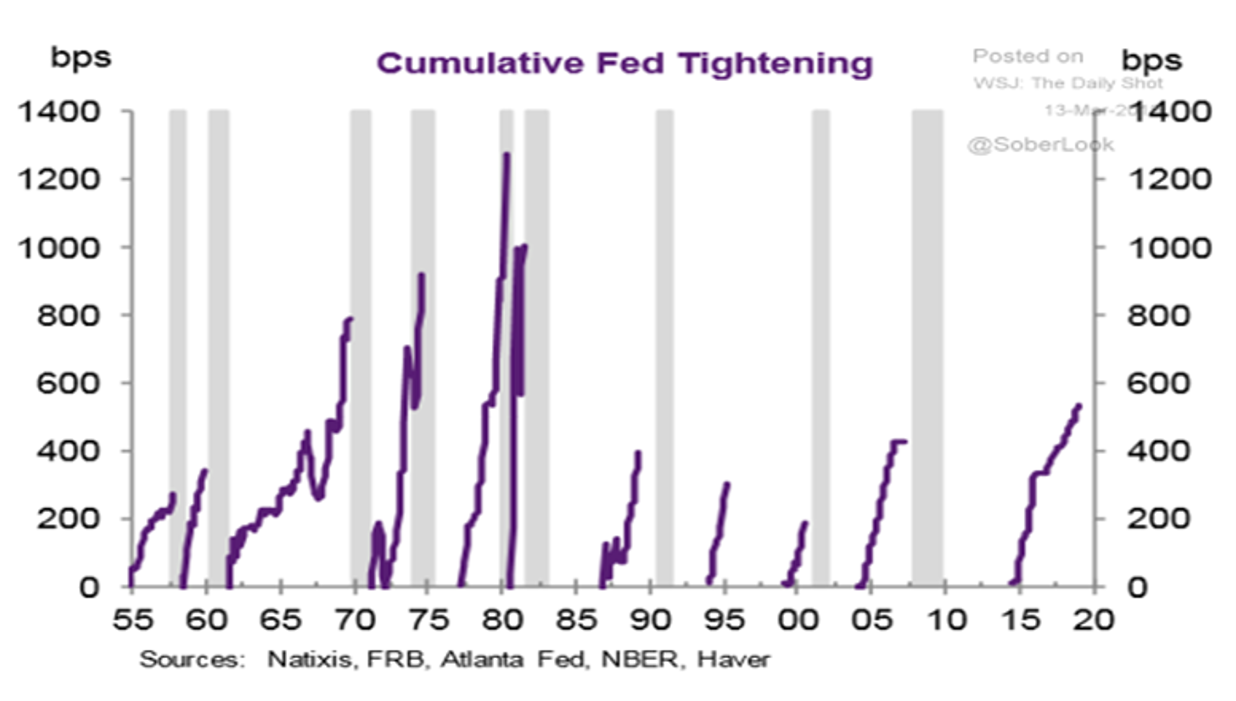
This long-term chart from Natixis was released a few years ago. It highlights the fact that the trend of tightening transitioned ahead of the Global Financial Crisis. Since that recession, the number of interest rate hikes has surmounted the last ahead of each successive recession. That suggests there will be at least 600 basis points of tightening before the next period of easing.
We are years away from that eventuality. The bond market is already pricing in a return of growth, inflationary pressures and the need to raise rates. The dilemma for investors is central banks have acted to backstop risk for at least the last twenty years and there is no reason to expect they will stop now.
If this cycle is going to be shorter but more powerful than what has been normal over the last decades, it makes the argument that there will be swifter rotations between sectors too.
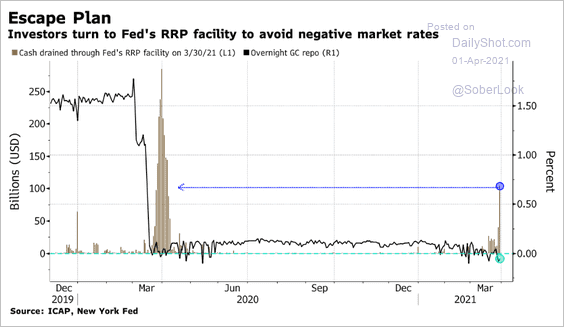
This graphic depicting the opening up of the RRP facility to avoid negative rates and disorderly activity in the money markets is a good example of that fact. The Federal Reserve has a de facto standing repo facility. They have no choice but to backstop the market when liquidity tightens. That’s true regardless of what happens in the wider economy.
The total return on bonds adjusted for CPI is back testing the upper side of the underlying range. This is a potential area of support for bonds. Conversely, a sustained move back into the range would be a significantly trend inconsistency which would give credence to the view that the long-term trend is ending.
I am now positioned for a rebound in bonds because I believe the pessimism around the sector is overblown and the challenges arising from the pandemic will not so easily be overcome. I simply do not believe the Federal Reserve is ignorant of the risks posed by the swift run-up in yields. It is quite likely that the opening of the RRP facility will facilitate a buy the dip in the near-term.
Medium-term the true test of the bear market hypothesis will be a failure to reach the previous highs and subsequently a move to new reaction lows.
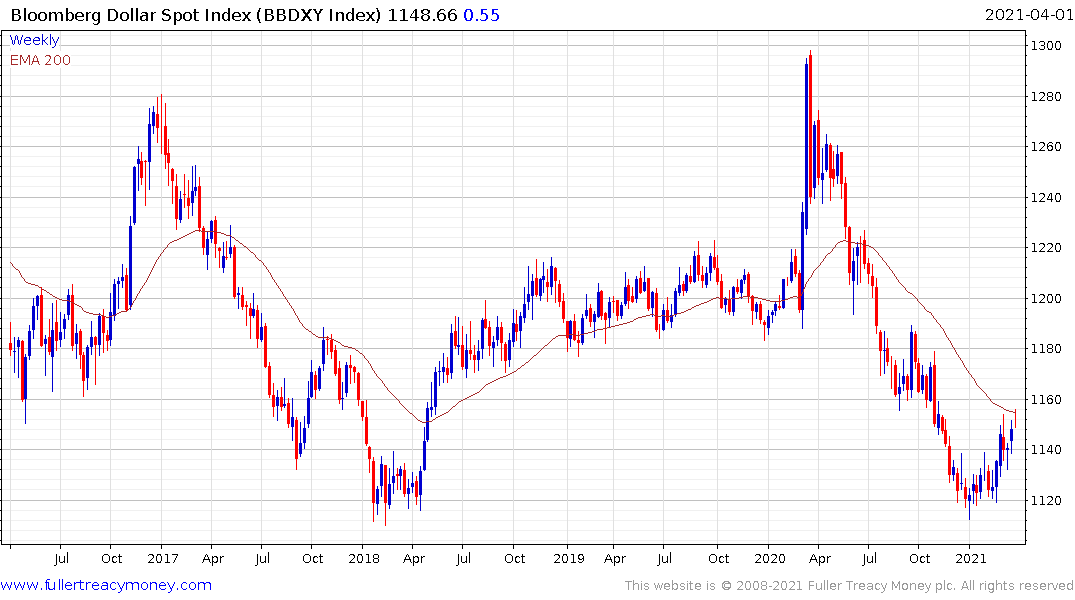
The Bloomberg Dollar Index is probably a better barometer of activity in the foreign exchange markets than the conventional US Dollar Index. It includes higher weightings for the Renminbi and Rupee and is now pausing in the region of the trend mean.
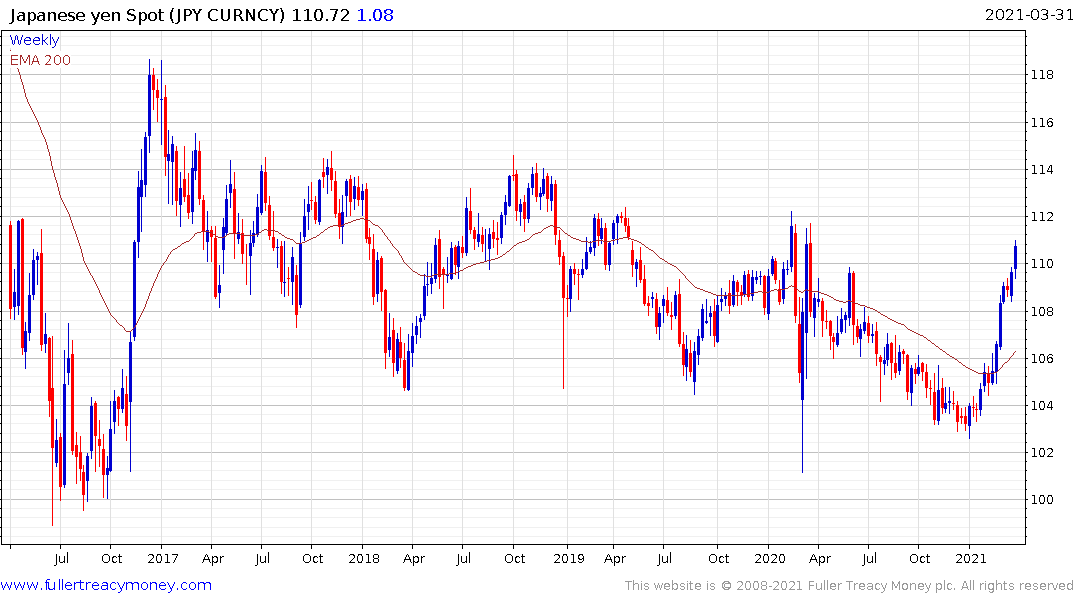
There is plenty of evidence of competitive currency devaluation of late. The Yen has pulled back sharply over the last two months and is now testing its five-year sequence of higher reaction lows against the Dollar.
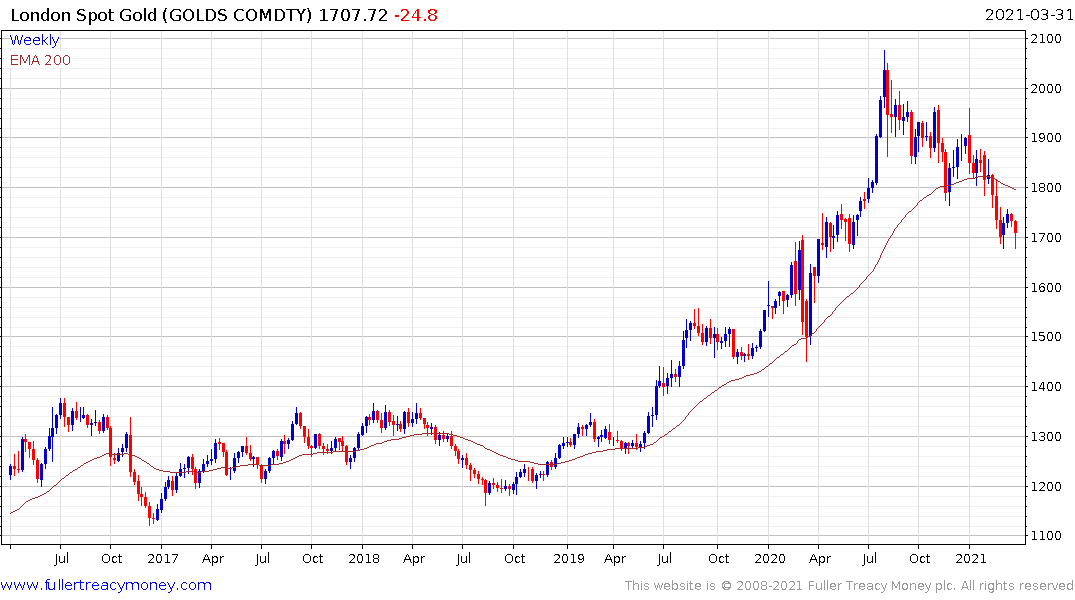
The gold price has now unwound all of its pandemic surge. It began to steady this week from the region of $1700. Gold has been in a corrective phase since August when the price was way overextended relative to the trend mean. Since then, the rise in bond yields has impacted the negative real interest rate environment in which gold thrives.
There is no way central banks are going to allow positive real interest rates to re-emerge. They need to erode the massive quantities of debt take on to fund pandemic remediation measures. Financial repression is the only way to do that so prevailing interest rates will stay below inflation rates for years to come.
Investors have willing to tolerate money printing on a vast scale for the last 13 years because central banks were willing to suppress yields. They are less than enamoured with the outright turn towards an inflationary bias, particularly when central banks are not actively supporting the market. This recent condition contributed to the gold price medium-term correction. As liquidity is made available their scope for renewed concern above active measures to devalue the purchasing power of fiat currencies. That suggests gold is near a medium-term low.
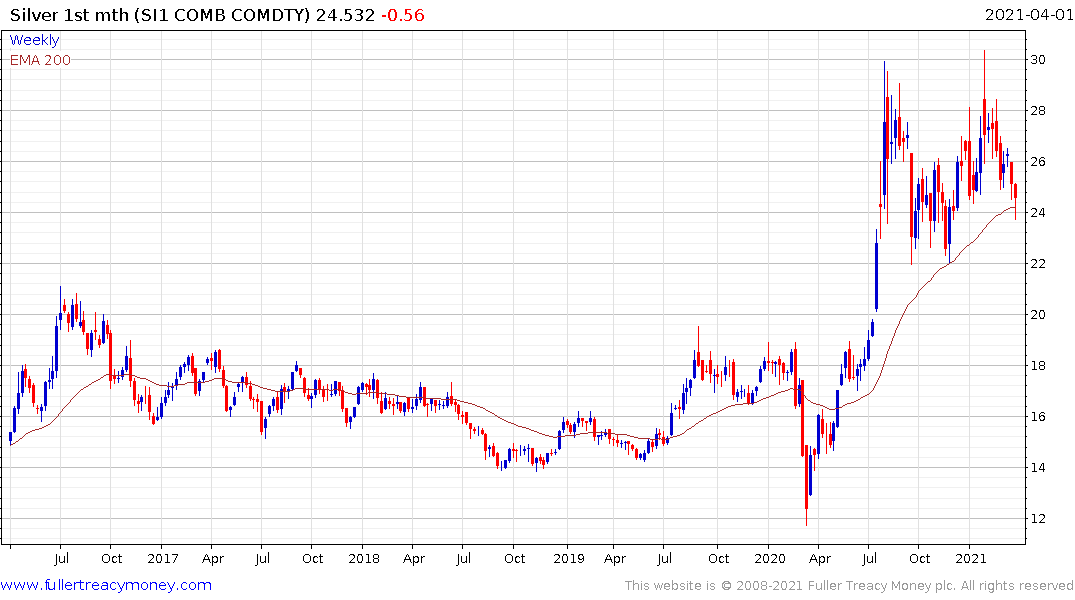
Silver continues to trend higher relative to gold. That is likely to remain the case for the rest of the bull market.
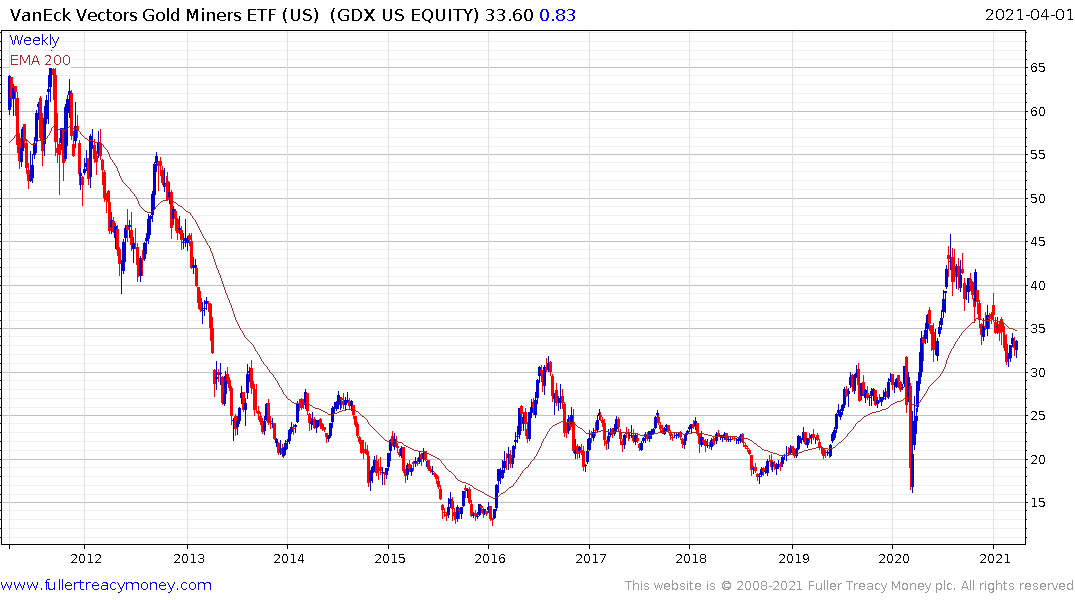
The Gold Miners ETF is back testing the upper side of its base formation.
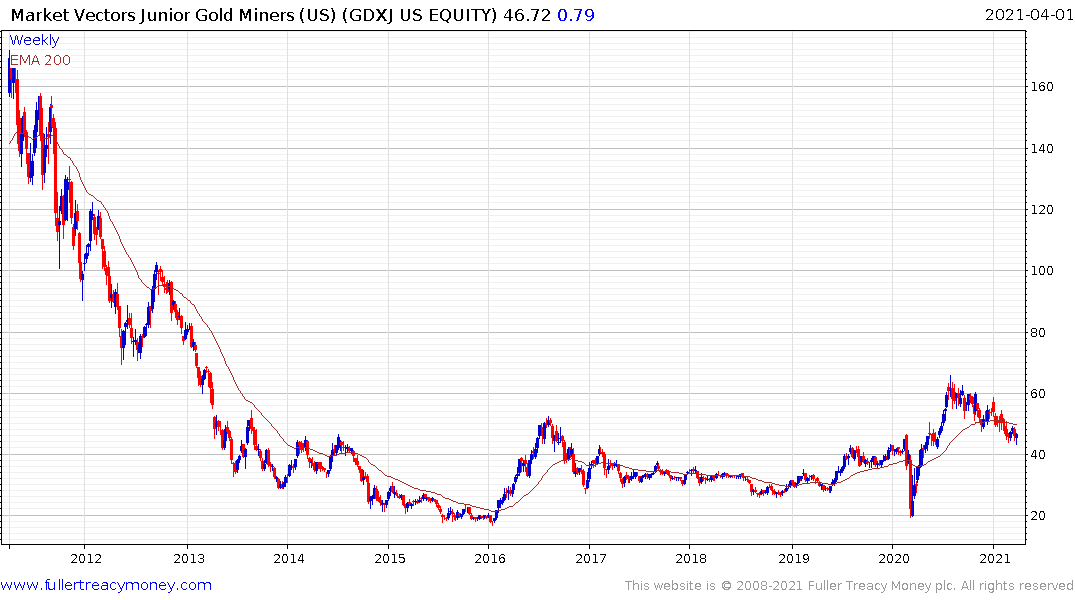
The Junior Gold Miners ETF is also back testing the upper side of its base.
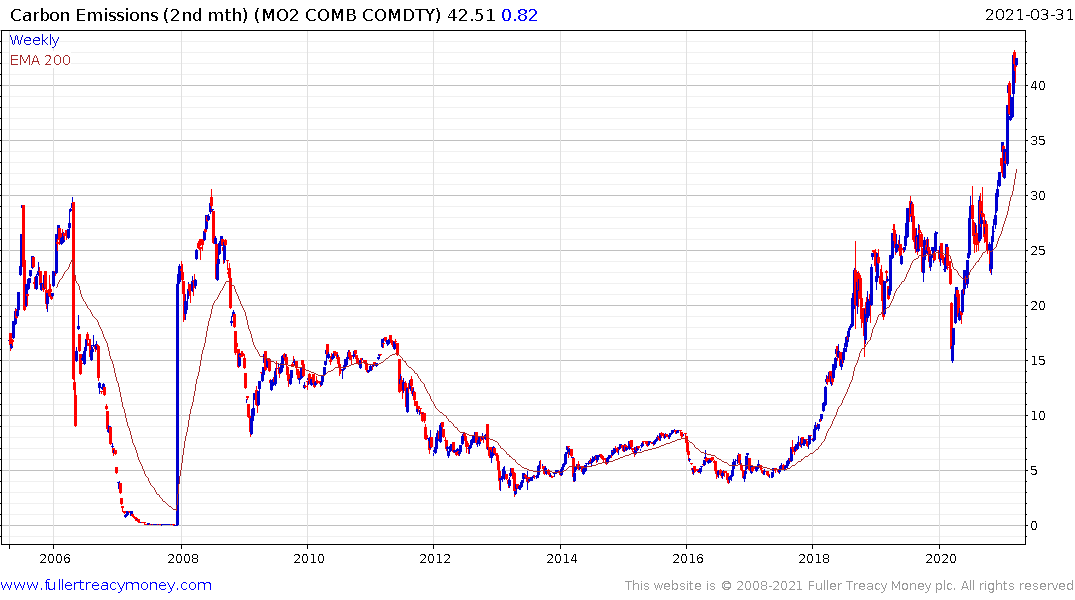
Another sector where the pandemic has accelerated pre-existed trends is renewable energy. Months of clear skies and clean city air have alerted people to the potential benefits of carbon free solutions. The arguments about the true carbon intensity of renewables, their durability and lower energy density have been raging for years. The reality, however, is that governments continue to favour them.
The USA is now effectively energy independent. Europe, Japan and China are not. They have a geopolitical imperative to achieve energy independence in order to remain competitive. They do not have easily accessible oil so they have little choice to champion renewables. The ultimate aim of pioneering wind and solar is to develop a liquid hydrogen fuel cycle which is more energy dense than oil.
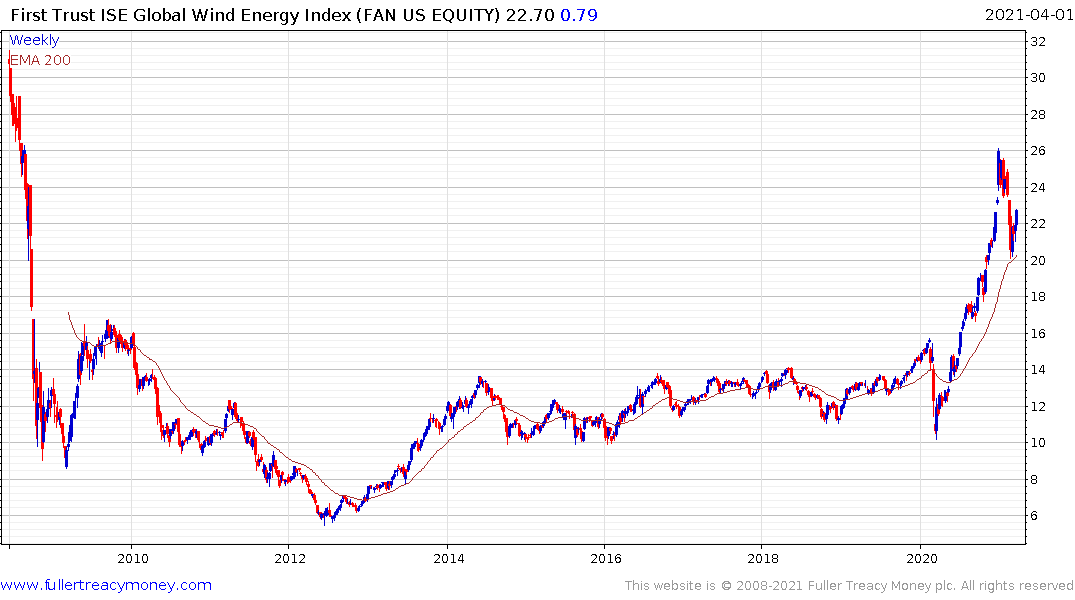
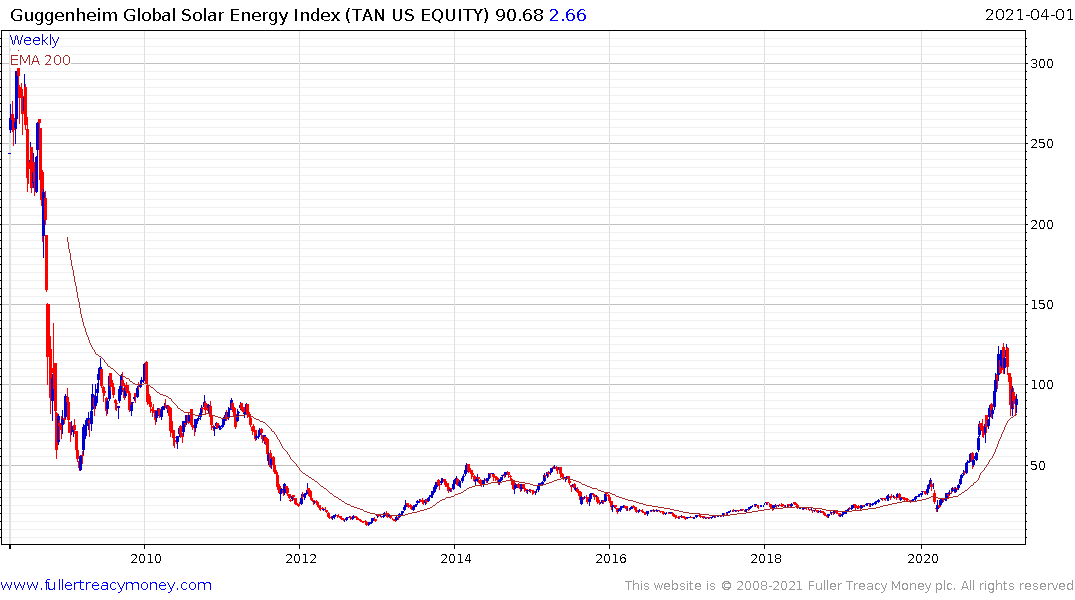
There are both push and pull factors to that trend. Political sponsorship for the uptrend in carbon emission prices is the push factor. It forces polluters to pay for their solutions that will mean their own destruction. The pull factor is energy independence greatly enhances balance of payments and reduces the role of oil prices in the economy cycle.
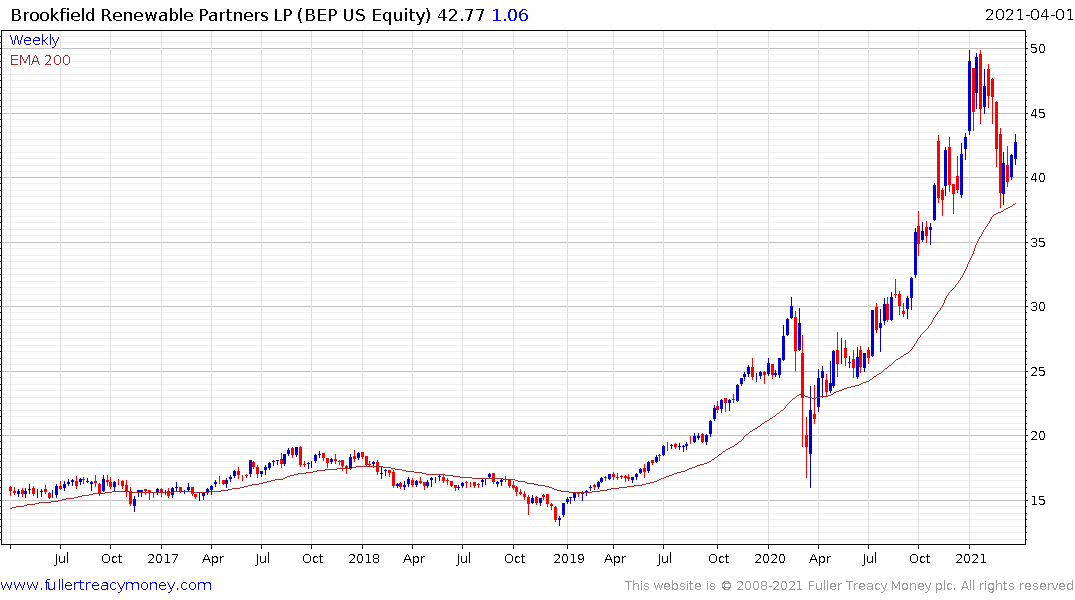
The Brookfield Renewable Energy ETF, Solar ETF and Wind ETFs are all bouncing from their respective trend means.
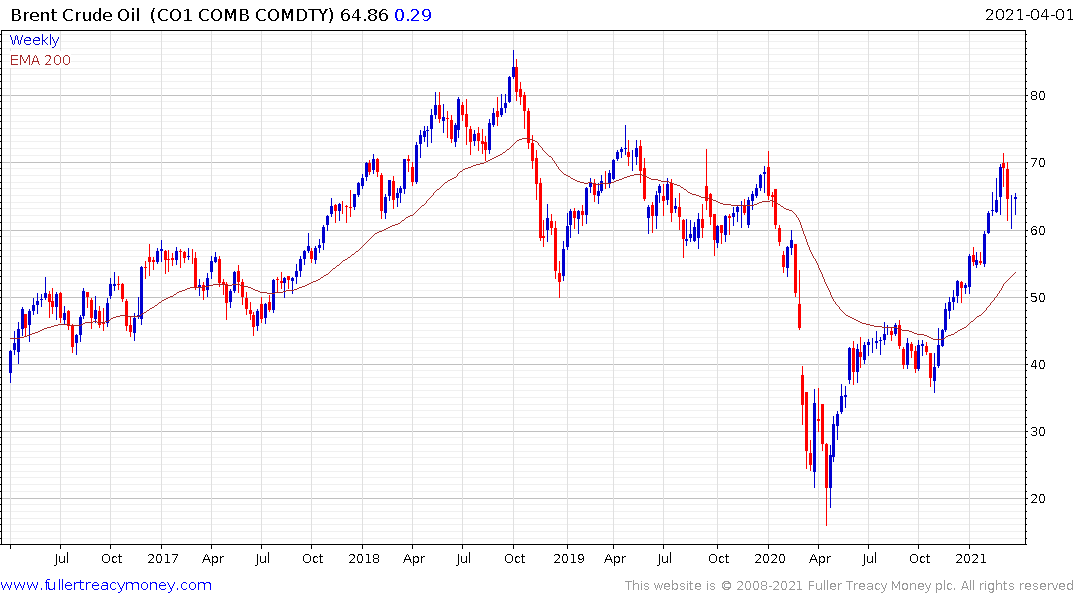
Oil prices have rebounded impressively from the 2020 lows and are now at levels where shale producers can hedge future production profitably. There is still a clear uptrend in prices but the higher it goes the greater the potential for a supply response. The primary limitation to a secular argument is there is plenty of supply that can be brought to market, and no need for a big new exploration cycle.
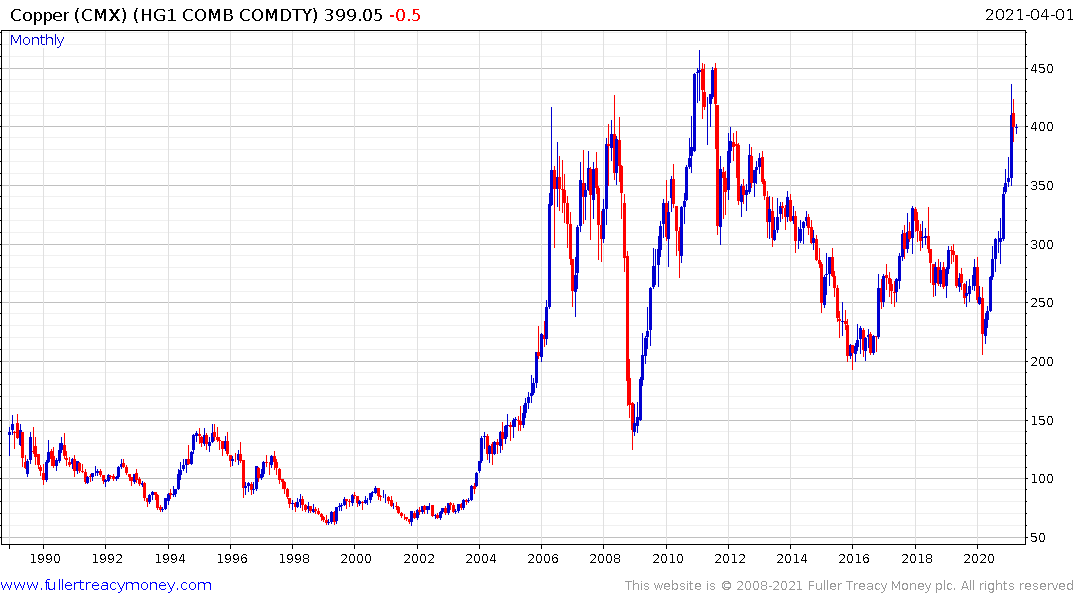
Copper on the other hand has secular bull market characteristics. It has massive new sources of demand in the electricity generation and transmissions sectors as well as the electric vehicles markets. Meanwhile, it takes years to develop new supply. The price is at the upper side of a 13-year range and there is ample scope for additional upside as infrastructure is built out.
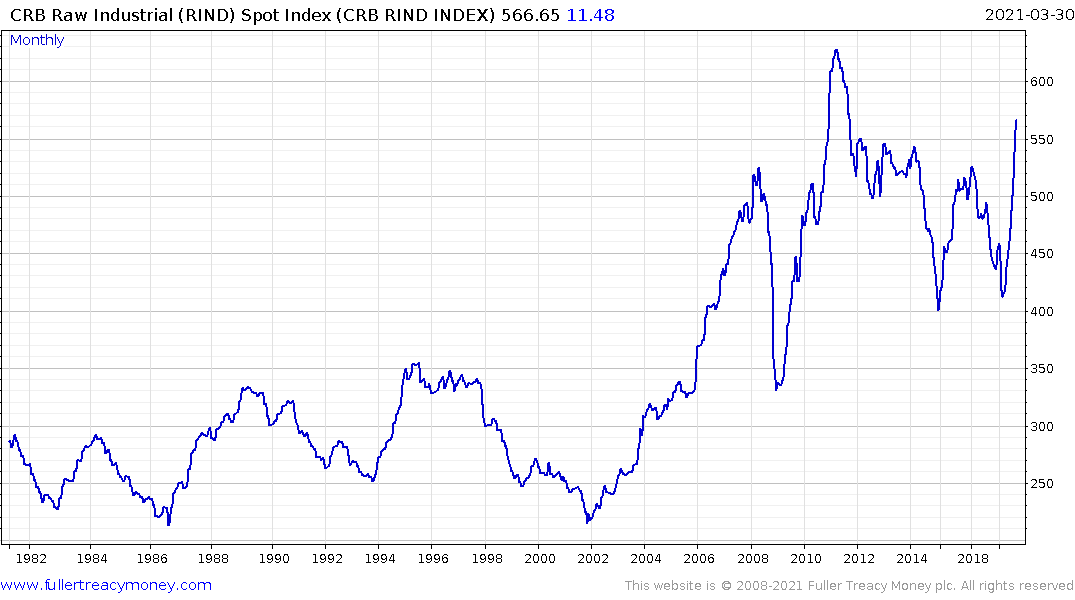
The CRB Raw Spot Industrial Metals Index has a similar pattern to the copper price.
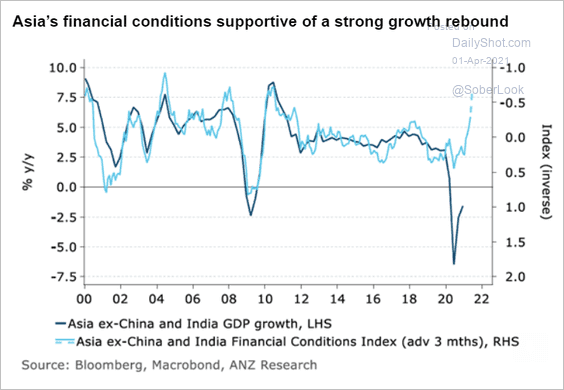
Asian Financial Conditions remain extremely accommodative and is helping to propel the regional recovery. Despite the uptick in geopolitical tensions, the region remains a global growth driver.
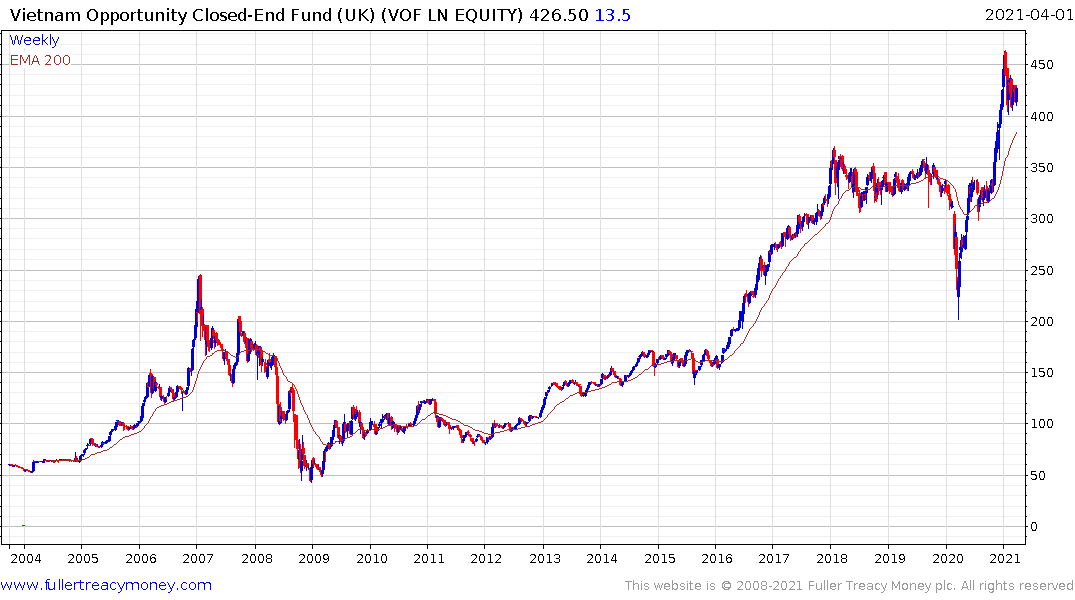
The Vietnam Opportunities Fund is firming within its range and has unwound its overbought condition relative to the trend mean.
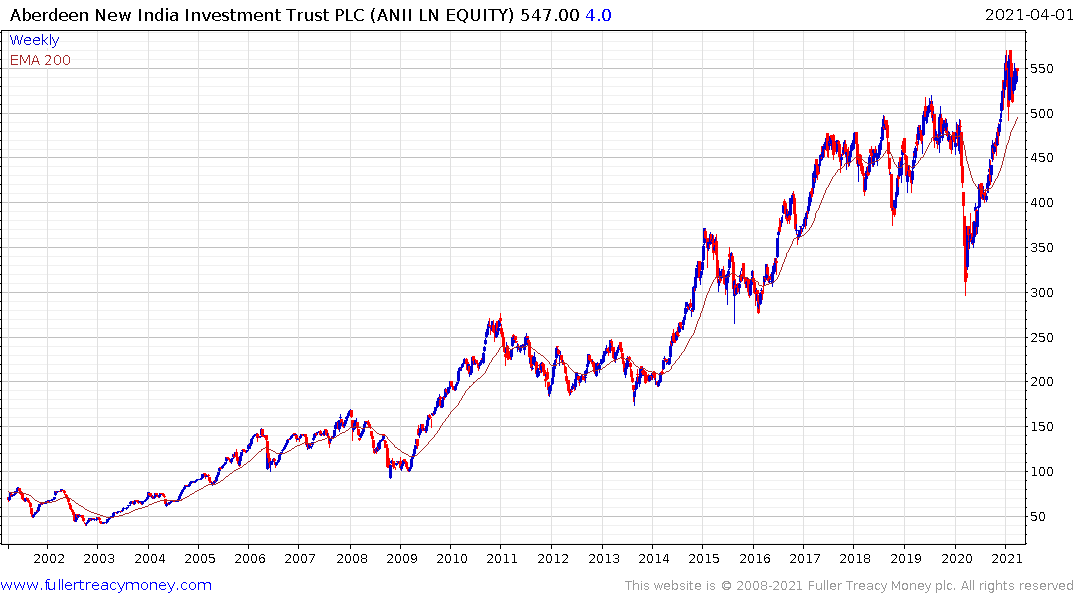
The Aberdeen New India Fund is putting in a first step above the 2017-20 range.
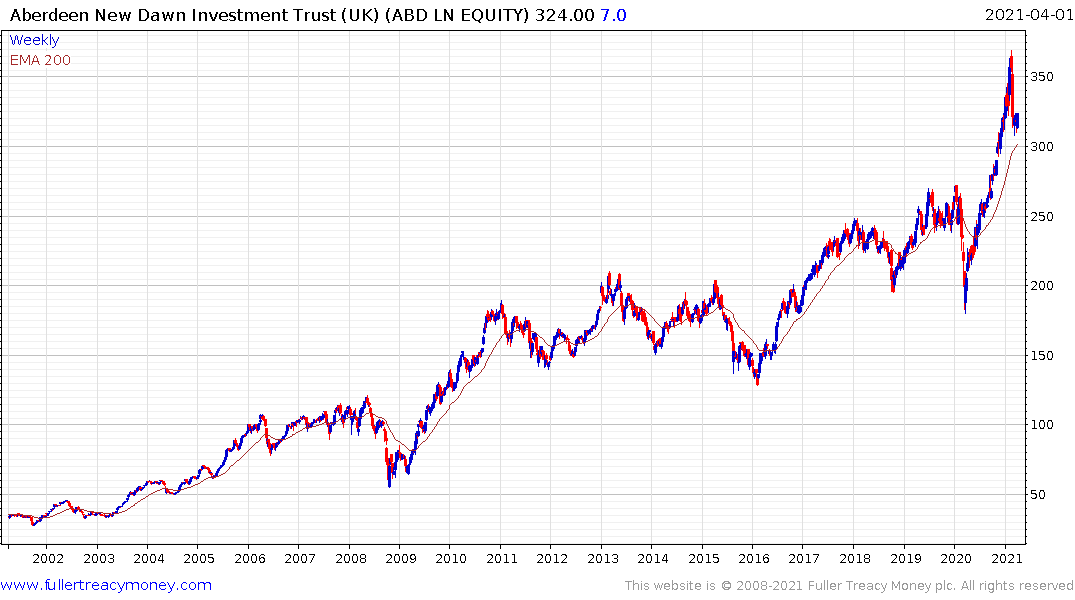
The Aberdeen New Dawn continues to firm from the region of the trend mean.
The biggest theme since the global financial crisis has been the dominance of liquidity as the fuel to inflate asset prices. With the Federal Reserve now opening up the repo market and the US government planning a $2.2 trillion additional stimulus, there is clear scope for assets of all hues to further inflate in price. That’s likely to be particularly beneficial to the gold, tech and bonds markets.
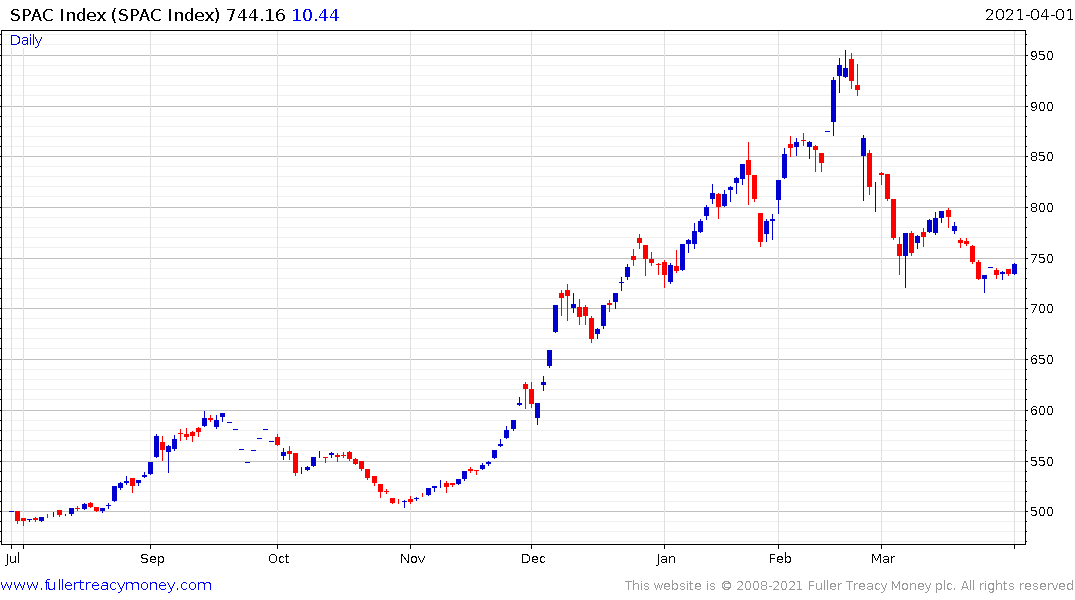
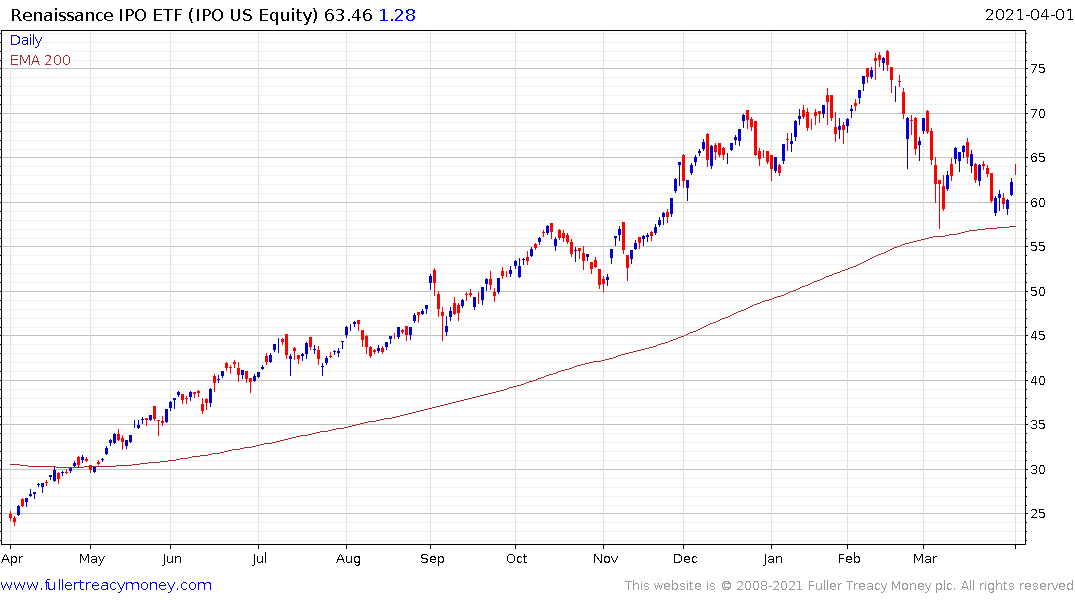
The SPAC and IPO ETFs rebounded from their respective trend means following the announcement of additional stimulus for example.