
Musings from the Oil Patch March 7th 2017
Thanks to a subscriber for this edition of Allen Brooks’ ever interesting report for PPHB. Here is a section on solar cells
A more recent analysis by the Lawrence Berkeley National Laboratory covering 1998 to 2015 shows a different measure of PV cost. (See Exhibit 15 on next page.) The pattern of that decline is interesting. It took 11 years for the price per watt to drop from $12 to $8. Notice how the cost per watt dropped between 1998 and 2000, but then remained flat until 2002, after which it declined for the next three years. Starting in 2005, the cost slowly increased for two years before beginning a slow decline that lasted for two years. In 2009, the pace of decline accelerated until it reached about $4 per watt, or half the 2009 value. The recent decline coincides with China’s entrance into the solar panel manufacturing business and its prompt dumping of surplus output into the U.S. market, driving down panel prices and driving U.S. manufacturers out of business.
It is difficult to separate how much of the historical price decline came from technological improvements versus that from a misguided investment strategy by China. More importantly, will these price reduction trends continue as in the past and how dependent on technological breakthroughs in material science are lower prices in the future?

Here is a link to the full report.
The cost of producing solar cells collapsed as China introduced economics of scale to the market. That has been perhaps the greatest influence on the price of cells and has contributed to the collapse of the investable sector because so many companies are now running at a loss. There have already been a significant number of bankruptcies and remaining companies are still in a highly competitive environment.
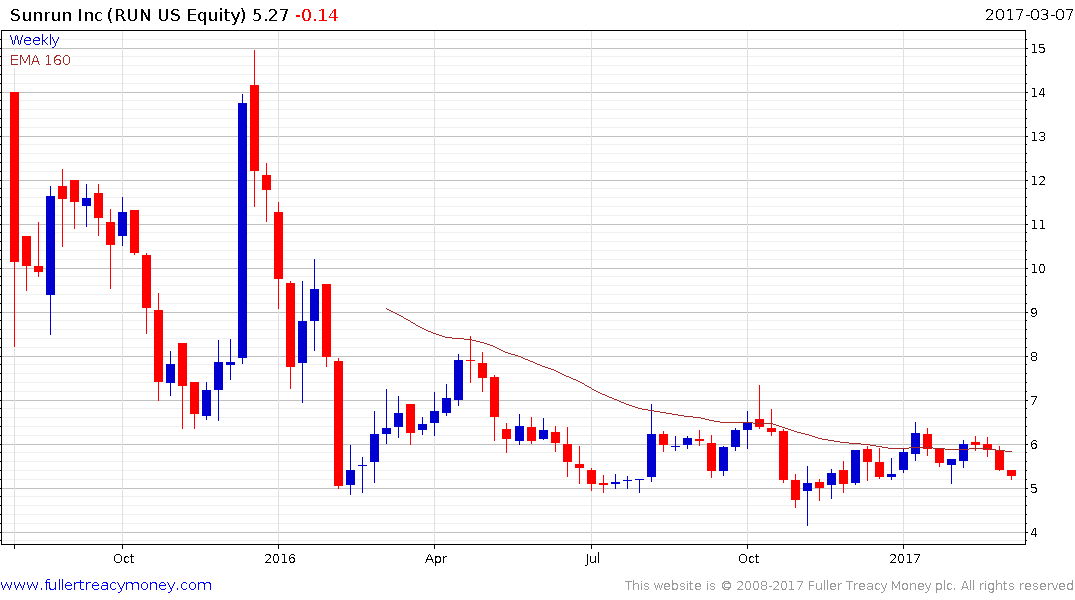
Sunrun with an historic P/E of 9.61 and an estimated P/E of 8.01. It IPOed later than most solar companies and is not a manufacturer. It installs and maintains panels so it is more levered to the growth the sector which is influenced both by the cost of the panels and state subsidies. It is not the first company to pursue an installation and lease back business plan and will need to control its debt if it is to be successful.
This chart from the NREL highlights how the efficiency of all types of solar cells has trended higher over the years but also how new technologies tend to come in at higher efficiencies or innovation sees their efficiency improve rapidly once introduced.
A chart of the relative cost of producing these different technologies does not yet appear to exist which represents the great uncertainty surrounding solar’s evolution. We simply don’t know how long it will take highly efficient new technologies to reach commercial viability against a background where older technologies are already considered cheap relative to coal and other fossil fuels.
Nevertheless, with the trend of innovation firmly on its side it would appear to be only a question of when rather than if new solar technologies reach market. For example this link to Alibaba is an example of how multi-junction panels are already being exported from China.
Back to top