Musings From the Oil Patch August 13th 2019
Thanks to a subscriber for this edition of Allen Brooks’ ever-interesting report for PPHB. Here is a section:
Today’s energy world is nothing like what it was prior to OPEC’s move. It is even moving away from the model that evolved immediately after the price collapse. Both of those models have been shunned by investors. A new model is evolving in response to investor demands that energy companies be profitable and return cash to investors. This new model is evolving in response to the disconnect between energy company fundamentals and their share prices. That disconnect is evident in Exhibit 8, which tracks oil prices and stock indexes reflecting oil and oil service companies since mid-2014 when oil prices began sliding, before OPEC delivered its coup de grâce. Oil company stocks (XLE) performed better during this period, largely because they pay dividends, offering investors income while waiting for share values to reflect higher oil prices. Oil service stocks (OSX) fell steadily in this period, because of too much debt and shrinking market activity leading to substantial asset impairment and eroding company values.
Here is a link to the full report.
If we are indeed now in a period where energy investors are more demanding of profits than production growth that is not great news for the fragmented nature of the shale oil sector. That suggests there is significant scope for consolidation to provide the profitability demanded by investors.
However, before that happens there is the question of how many companies will need to go bust first? The vast majority of shale producers see $50 as a breakeven and WTI is currently trading at $54. That’s not a comforting margin of error and there is a downward bias to pricing.

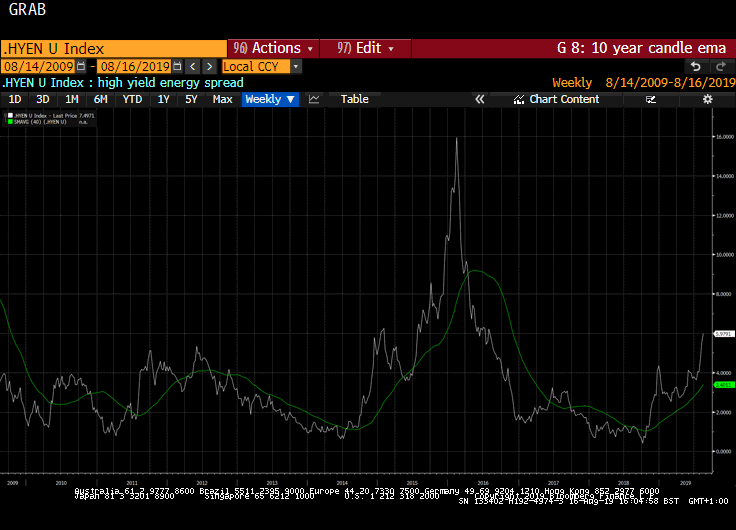
High yield energy spreads of 10-year Treasuries have broken out and is an important factor in the divergence between the high yield sector and the wider bond markets.

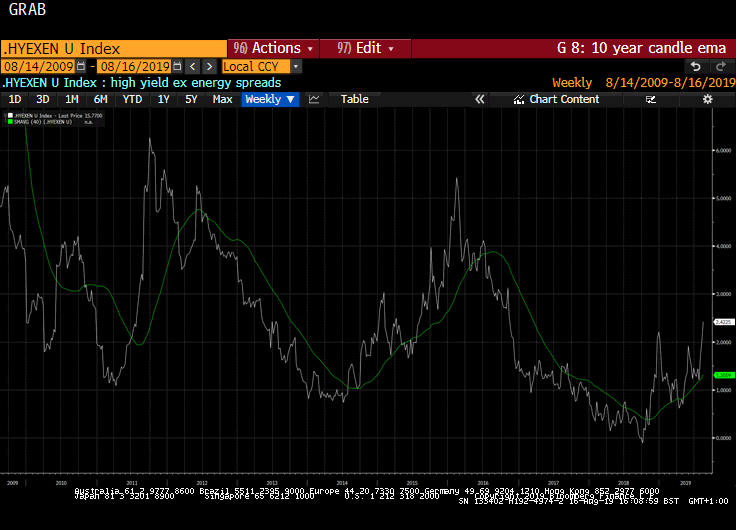
The high yield ex-Energy spread over Treasuries is trading at a much tighter spread.
These charts suggest it is the energy sector that represents a potential flash point for the high yield sector and wider perceptions of credit quality in the corporate sector.
Back to top

