
Long-term themes review May 16th 2018

FullerTreacyMoney has a very varied group of people as subscribers. Some of you like to receive our views in written form, while others prefer the first-person experience of listening to the audio or watching daily videos.
The Big Picture Long-Term video, posted every Friday, is aimed squarely at anyone who does not have the time to read the daily commentary but wishes to gain some perspective on what we think the long-term outlook holds. However, I think it is also important to have a clear written record for where we lie in terms of the long-term themes we have identified, particularly as short-term market machinations influence perceptions.
Here is a summary of my view at present:
Let me first set up the background, I believe we are in a secular bull market that will not peak for at least another decade and potentially twice that.
It is being driven by technological innovation especially in the energy and healthcare sectors which have the potential to deliver productivity growth over the long term.
The best graphic illustration we have for the long-term cyclical nature of stock market performance is the Dow/Gold ratio because we have more than 100 years of history. There has been an average of 35 years between major stock market peaks and the last major peak for the ratio was in 1999. That suggests we are about half way through this secular bull market for stocks versus gold.
However, if we look at history there have been corrections along the way for stocks versus gold and the tide may be turning in gold’s favour for a short to medium-term period of outperformance.
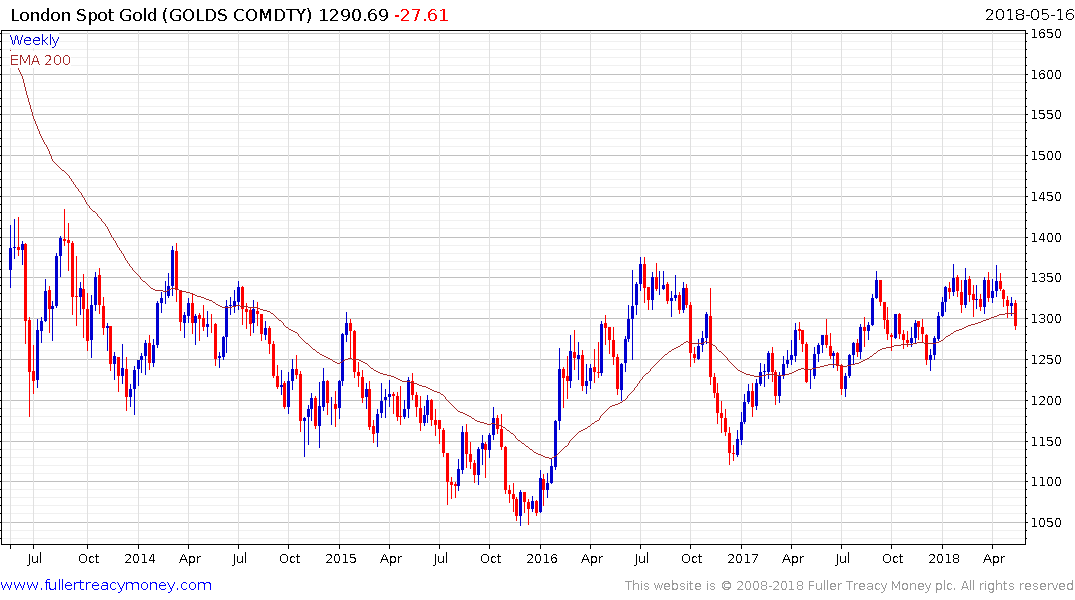
It will not have escaped the attention of subscribers that the gold price has been ranging for five years already and that a saucering pattern is evident which is generally consistent with accumulation. It is quite normal that after a Type-2 bottom, which is characterised by a massive reaction against the prevailing trend, that a period of ranging follows. Gold has held a progression of major reaction lows since early 2016. In that time the price has dipped below the trend mean on five occasions, with the most recent occurring this week. If the upward bias is to remain intact it will need to bounce in a similar manner to the other occasions it has pulled back.
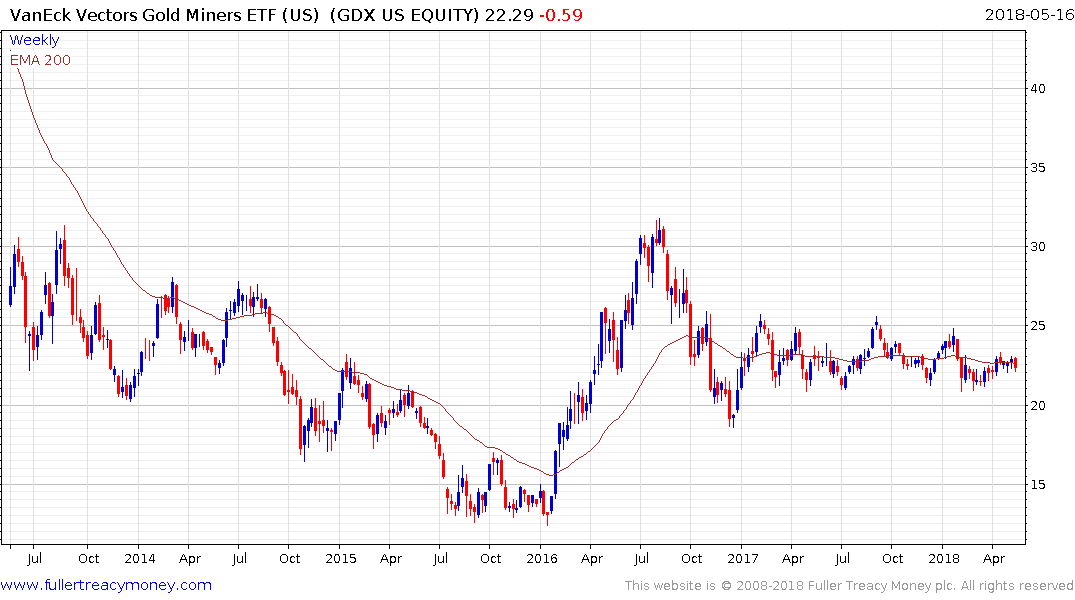
Gold shares are about the most under owned asset class at the moment considering the fact that the marginal cost of production is on average in the region of $1000.
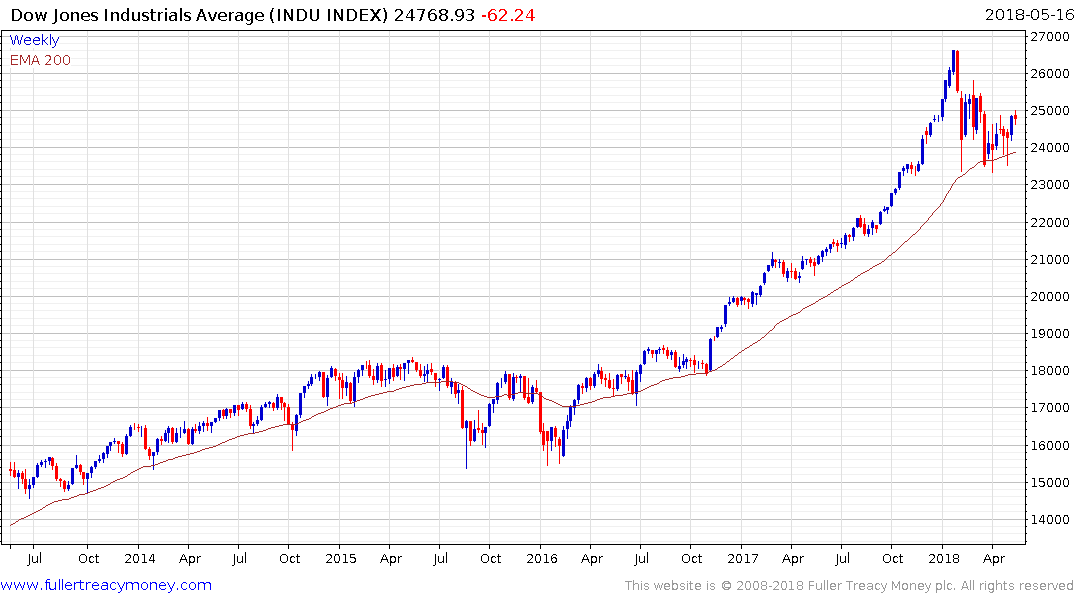
Concurrently, the Dow Jones Industrials Average has experienced two large downward dynamics since late January and has bounced from the region of the region of the trend mean on three separate occasions. In a reasonably consistent uptrend, reversions to the mean generally represent opportunities to increase long positions so there is a logical argument for thinking of this correction as a buying opportunity on weakness. There is still likely to be a period of support building but the majority of global indices have demonstrated at least near-term support.
Let’s spend a little time to address the consistency of the trend upward from the 2009 low. It was pretty choppy between 2009 and the end of 2012 which fits with the first psychological perception stage of disbelief. The trend then became more consistent between 2013 and the middle of 2015 which was where investors accepted the role played by central bank liquidity provision in supporting asset prices. That was the second psychological perception stage of this medium-term bull market. The medium-term correction between 2015 and late 2016, which was eventually resolved on the upside and initiated the steep advance over the up to the January 2018 peak was predicated on loose fiscal policy replacing loose monetary policy.
Quite apart from the acceleration which is a clear Type-1 trend ending, the widespread acceptance that stock picking is a waste of time and that the only way to invest is via ETFs is synonymous with the triumph of the buy-and-hold strategy. That view is characteristic of the third psychological perception stage of every bull market.
Let’s remind ourselves, at The Chart Seminar we define acceleration as a trend ending, but of undetermined duration. The January peak for the Dow Jones Industrials Average, S&P500 and Nasdaq represents a peak of medium-term duration.
So, if we are in a secular bull market but have seen a medium-term peak what’s next? So far, the lows are holding but there is no denying we are late in the medium-term cycle. If we get a failure at the trend mean it will be the first time since 2016 that the major indices have traded below their 200-day MAs and that would represent a major trend inconsistency, particularly following the acceleration last year.
I believe one of the most important points is that markets are endlessly fractal. We see the same psychological processes playing out on short-term trends as multi-decade trends. The only difference is time and scale. If the broad stock market is in a corrective phase we could see volatile ranging for anything from six to eighteen months. That is the best-case scenario. The worst case is that the geopolitical situation turns progressively more hostile and damages sentiment to such an extent that investors begin to unwind long ETF positions.
.png)
Interest rates are beginning to rise as the global economy transitions from synchronized monetary expansion to fiscally driven economic expansion. The introduction of deficit spending, dressed up as fiscal stimulus, in the USA has the potential to foment inflation. With the Federal Reserve buying fewer bonds and the Treasury issuing more of them, it is logical that yields will rise further over the medium-term. That is likely to be the causal factor behind the next recession but the lead indicators for recessions such as the yield curve spread, unemployment or high yield spreads do not suggest a recession is imminent.
Treasury yields have been in a base formation since 2013 and arguably since 2011. There is increasing evidence that the break about 3% on the 10-year Treasury is going to be sustained and that represents base formation completion.
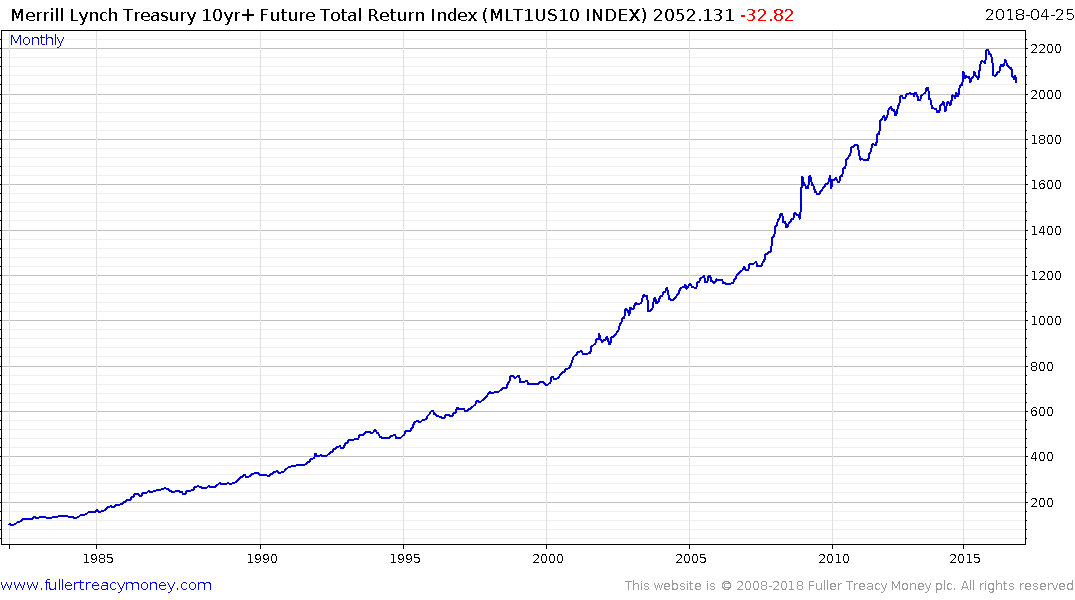
The Merrill Lynch 10-yr+ Treasury Total Return Index has completing long-term Type-3 top formation characteristics. Bonds of highly indebted countries look like particularly bad long-term investments as a result.
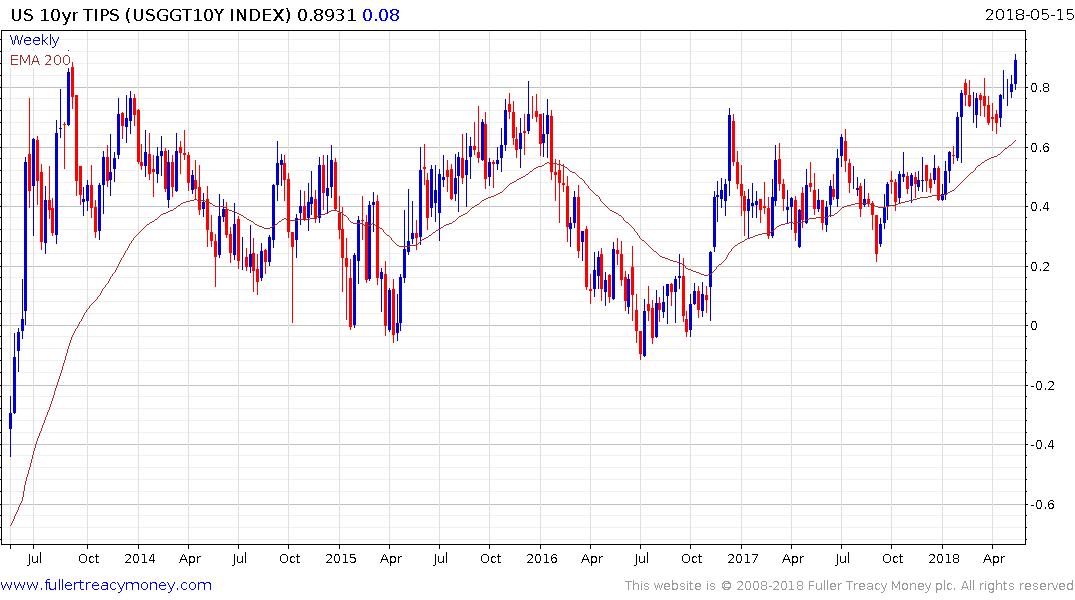
TIPS yields have been ranging below 80 basis points since 2013 but are now breaking out. If the Treasury market is being influenced by additional supply, the breakout in TIPS yields is animated by inflation fears since there is no additional new supply planned.
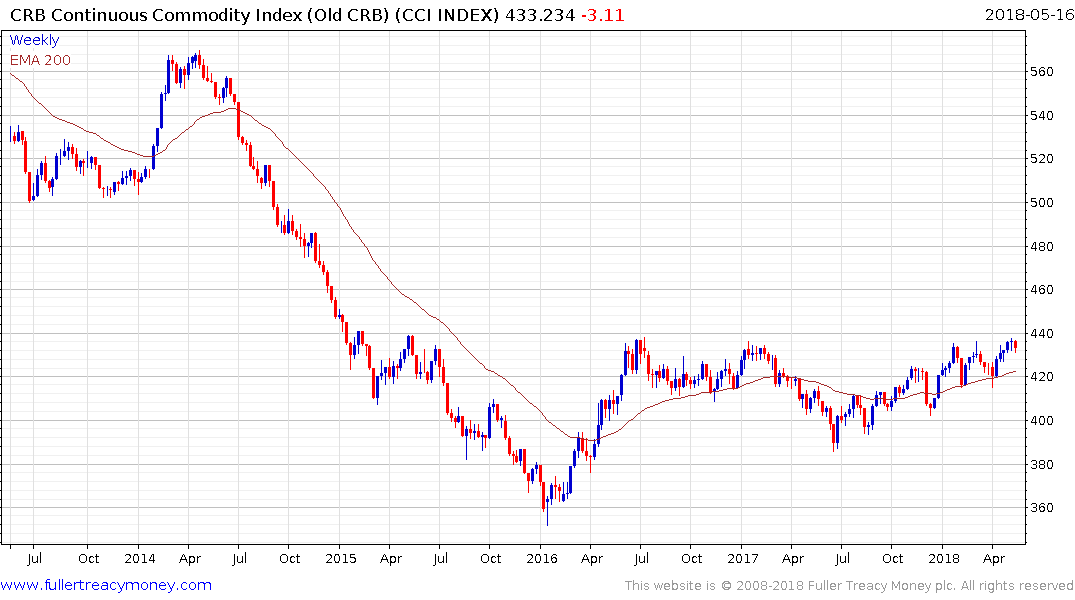
Gold has been forming a saucering pattern below $1400 since 2013. The Continuous Commodity Index has been ranging below 440 since 2016. Every one of these charts is a range and we describe ranges as explosions waiting to happen. The fact they all respond to rising inflationary pressures by moving higher should be a warning to anyone who looks at charts that inflation could come back with a bang this year.
What about protectionism? This is a non-trivial risk. China has fostered a harem of national champions by excluding competitors, offering massive financial and regulatory incentives and engaging in an historically unprecedented policy of industrial espionage.
The Trump administration is now attempting to combat that policy with aggressive tariffs which are likely to harm the US economy as well as the Chinese one. China is attempting to take the moral high ground and is adopting the façade of being the more reasonable party, but there is no denying the role it has had in ignoring patent law for decades.
The simple fact of the matter is that China is not evolving into a free market economy; rather the opposite. It has declared itself an international competitor of the USA and is now effectively a dictatorship. China therefore requires an additional risk premium from the perspective of international investors. It would be hard to argue standards of governance are improving in the country.
One of the things many people worry about is that inequality has become a structural issue for a lot of countries. When credit is abundant and economies and wages are growing they paper over a lot of cracks in the social infrastructure. The advent of both globalization and technological innovation have been highly disinflationary, while also creating an environment where the emerging markets have flourished.
At the same time offshoring and greater competition have resulted in large numbers of disaffected workers in the rust belts of major economies. These communities, which were once the bedrock of the economy are now riven with unemployment, declining standards of living and drug abuse.
In democracies that condition is unsustainable which is giving rise to reactionary parties for people all over the world who ask “What about me?” Rather than characterise this movement as populist, xenophobic, anti-immigrant or racist I believe it is more correct to view them as symptoms of a wider revolt against the status quo. Protectionism is about as close to the polar opposite of globalization as I can imagine. It fits squarely into the revolt against the status quo I have been talking about for two years and it is also inflationary.
The answer to the question “What about me?” is “Here, have some money” That decision to embrace appeasement rather than tackle the basic structural issue is highly inflationary.
The largest weightings in the world’s largest stock market indices are global companies with extensive franchises so protectionism is bad news. Right now, tariffs are being imposed on China but US allies are being exempted. Therefore, the companies most at risk are those with large Chinese operations as well as Chinese companies with big international franchises. A medium-term correction is generally characterized by anything from a 10% to 20% correction.
There has never been a long-term secular bull market that has not been punctuated by the occasional recession but these have generally been buying opportunities from the perspective of long-term investors.
So, the big question many people have is if we accept the bullish hypothesis how do we justify the second half of this bull market based on valuations where they are today? Technological innovation is going to get us a good part of the way and we already have plenty of evidence of that. There is an increasing body of evidence that the decline of manufacturing has more to do with globalization and offshoring than automation. In fact, there is a clear correlation between the countries that have embraced automation and vibrant manufacturing sectors. That suggests technology is the answer to productivity declines rather and the cause.
However, the answer is also going to have to include inflation. The breakouts increasingly evident in sovereign yields and other inflation sensitive sectors suggests inflation is on the rise. Generally speaking the stock market reflects the inflation rate.
Interest rates are beginning to rise as the global economy transitions from synchronized monetary expansion to economic expansion. The introduction of deficit spending, dressed up as fiscal stimulus, in the USA has the potential to foment inflation. With the Federal Reserve buying fewer bonds and the Treasury issuing more of them, it is logical that yields will rise further over the medium-term. That is likely to be the causal factor behind the next recession but the lead indicators for recessions such as the yield curve spread, unemployment or high yield spreads do not suggest a recession is imminent.
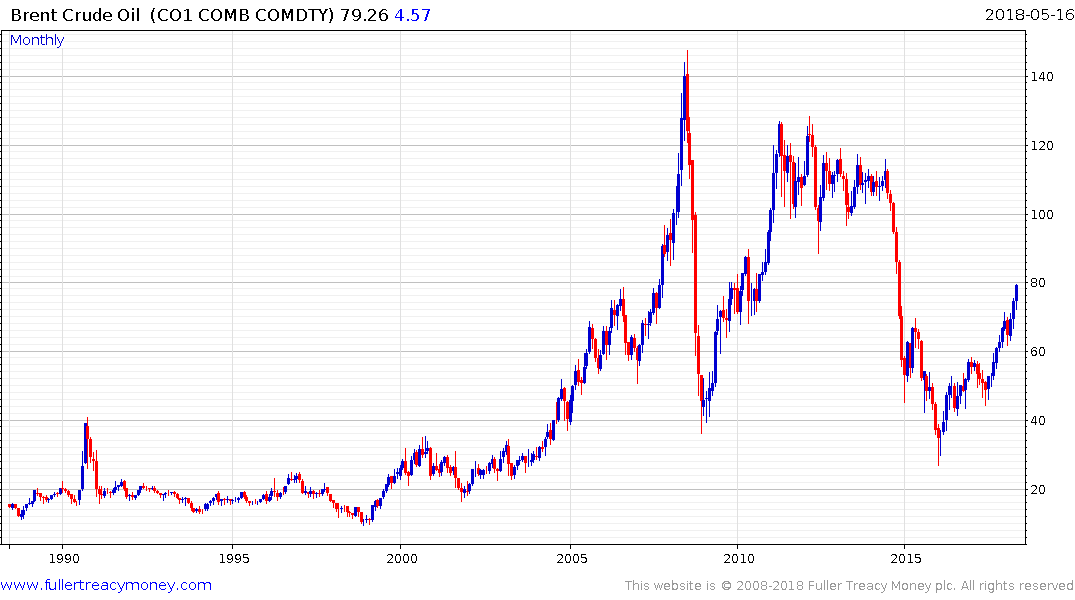
Energy prices, represented by oil, tend to move in long-term bull and bear market cycles. We’ve had an impressive bull market and now we are in another lengthy ranging phase which could last another decade. My working hypothesis at present is that $70 represents the point at which additional new supply is brought to market. However, rising geopolitical tensions represent a tailwind for prices and the price is now testing that level. A clear downward dynamic would be required to question current potential for additional upside.
Surging oil prices have generally presaged recessions so this is an important market to monitor if prices do indeed break higher and accelerate towards $100 irrespective of increasing supply coming to market.
Technological innovation is also working its way through the energy sector as unconventional supply moves mainstream. Concurrently battery manufacturing scale and better chemistries continue to reduce costs while governments are mandating increasing demand. For example, Tesla announced 8:1:1 chemistries (nickel: manganese: cobalt) have already been delivered in its Model 3. That represents a significant headwind for the oil sector over the medium to long-term, but it removes a headwind to growth for oil consumers.
Improving governance, capitalism and free markets have lifted billions of people in the emerging markets out of abject poverty and into the middle classes. This is contributing to productivity gains which is driving growth in the world’s major population centres. Rising protectionism will not derail that trend provided we see continued improvements in the standards of governance.
The global population is expected to expand by an additional 2 billion people within the next 20 years and the majority of those people are going to be in Africa. Considering the evidence, we already have that technology both promotes growth and detracts from it, the only way Africa is going to emerge to the point where individual countries can reach their productive capacity is through improving governance.
With a continent the size of Western Europe and North America combined there are going to be both success stories and failures so it is important to remember that standards of governance are not an absolute. It is the trajectory that is important. We need to ask ourselves whether conditions are improving or deteriorating. Dumping Zuma was a major step forward for South Africa while Ethiopia’s single party government clamping down on protests can be viewed as a retrograde step.
Elsewhere there is ample evidence of improving standards of governance delivering on productivity growth not least in ASEAN and India which remain in secular, albeit volatile growth trajectories.
Generally speaking it is in the latter stages of a cyclical bull market that cyclical sectors outperform. Mining, energy, banking and biotechnology all fall into that category because they are all leveraged to global growth and access to liquidity.
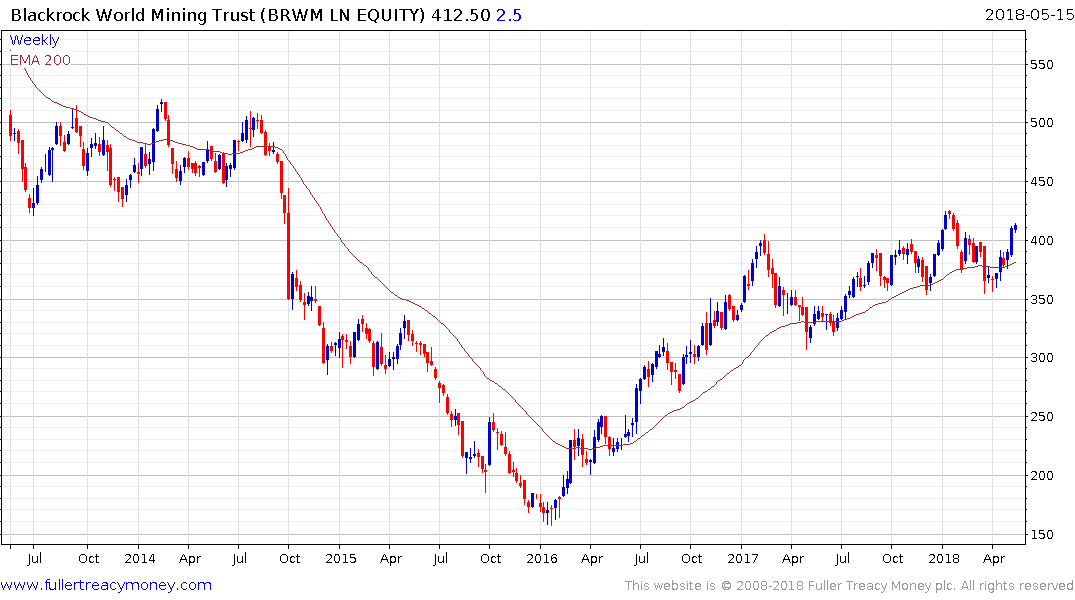
The BlackRock World Mining Trust is trading at a discount to NAV of 9.29% and has bounced from the region of the trend mean to retest the recovery high.
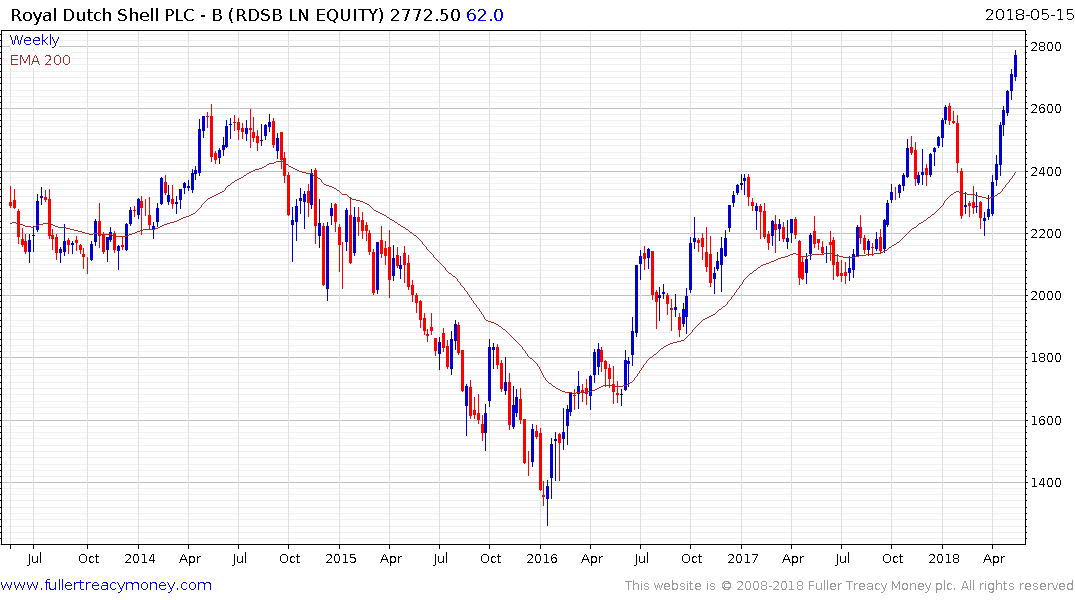
Royal Dutch Shell’s pivot to natural gas production more than a decade ago and increasing focus on that sector continues to pay dividends and the share yields 5.1%. With renewed strength in the energy complex it has rallied impressively over the last six weeks and a short-term overbought condition is now evident.
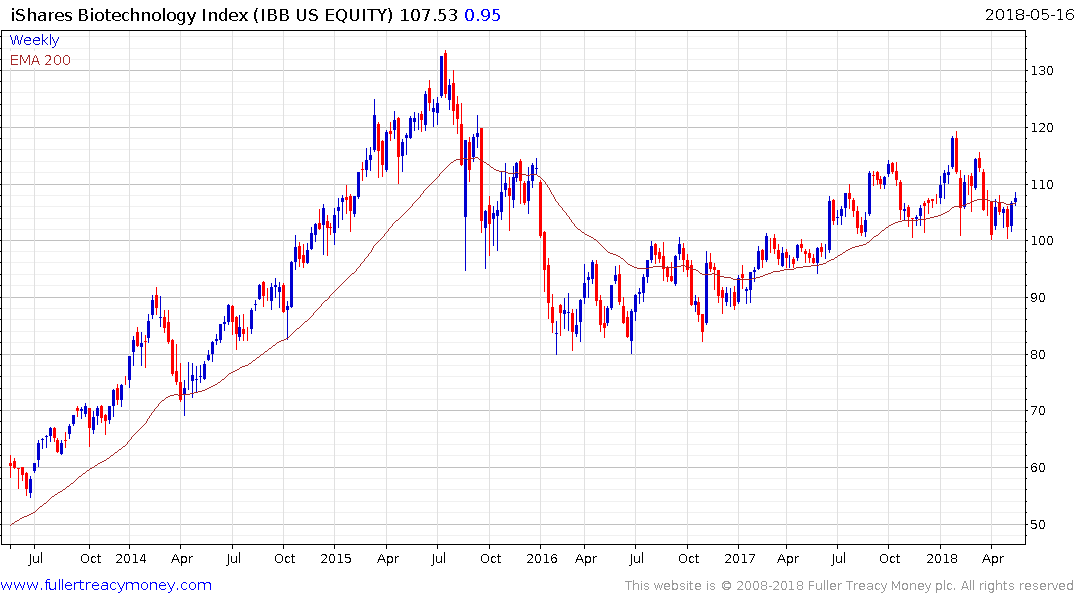
The iShares Biotechnology ETF (IBB or SBIO in the UK) is back testing the region of the trend mean and is exhibiting initial signs of steadying. The long-term outlook for biotechnology remains very positive. As quicker, cheaper and more detailed genetic testing, editing and synthesising reach commercial utility, the convergence of these technologies has the potential to deliver truly personalized medicine.
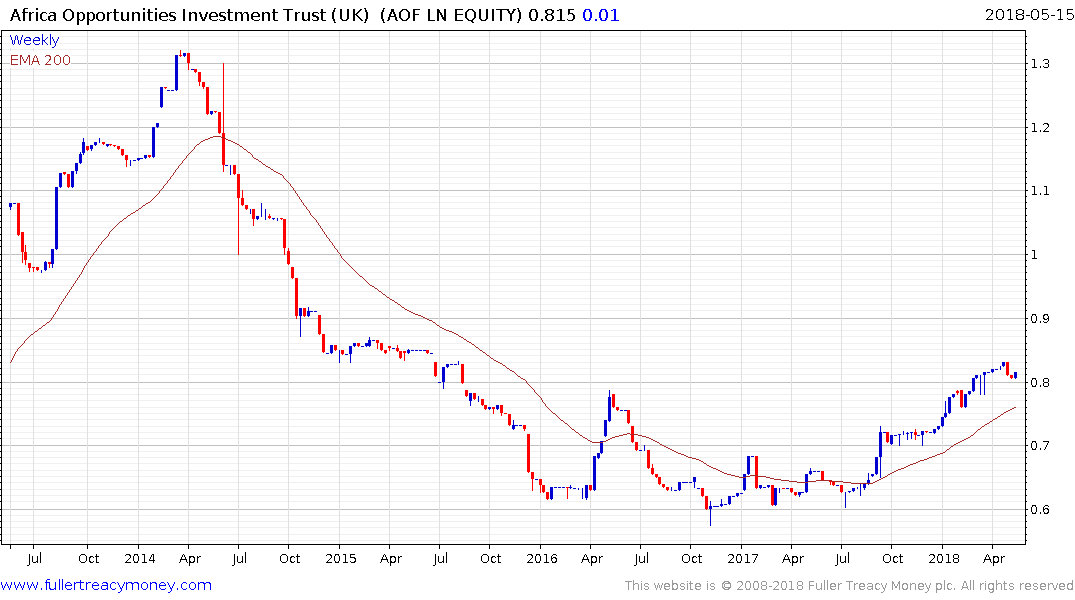
The Africa Opportunities Trust (AOF LN) trades at a discount to NAV of 16.49% and broke out to new recovery highs in April. Some consolidation of that move is underway but a sustained move below the trend mean would be required to question medium-term scope for additional upside. As a cyclical sector also has potential to perform in the latter stages of a medium-term bull.
Longer term, India remains one of our favourite markets. The Rupee is back testing its lows near INR68 where it will need to stabilise if medium-term support building is to given the benefit of the doubt. The rollout of 4G to the whole country, combined with the completion of the nation’s biometric data collection efforts, suggest India is on the cusp of a digital growth phase that could help drive outpaced economic expansion for the foreseeable future. Nevertheless, India does not exist in a vacuum and trade wars could weigh on the market in the short term.
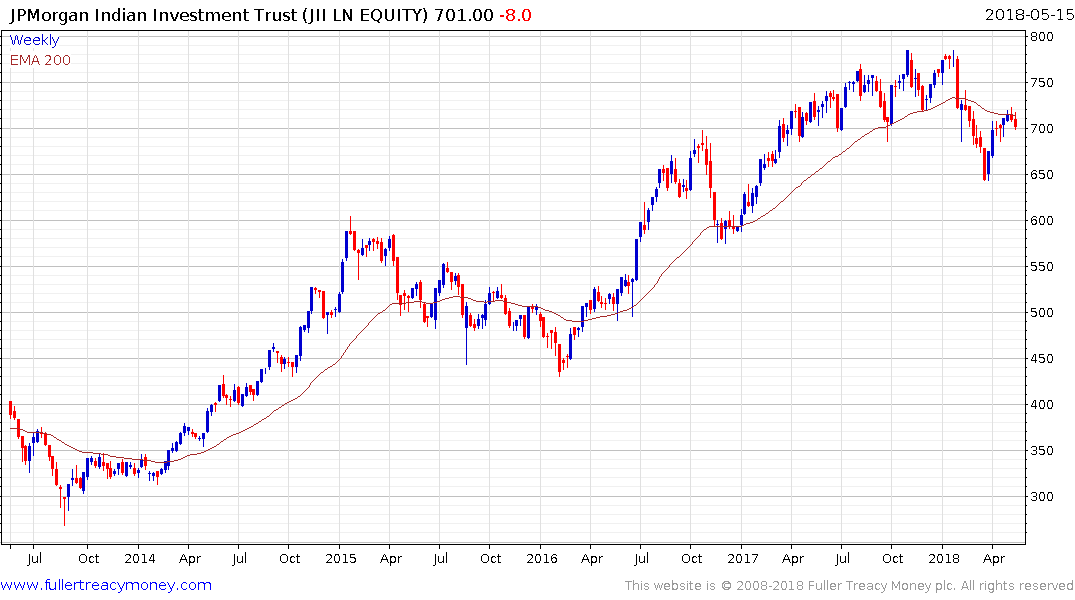
The JPMorgan India Investment Trust trades at a discount to NAV of 13.5% and has pulled back below the trend mean. Following a rebound over the last six weeks, it has paused in the region of the MA. The underperformance of the Trust can be almost entirely attributed to the weakness of Rupee so it’s ability to sustain a move above the MA is also likely to be dependent on whether the currency can continue to hold its lows.
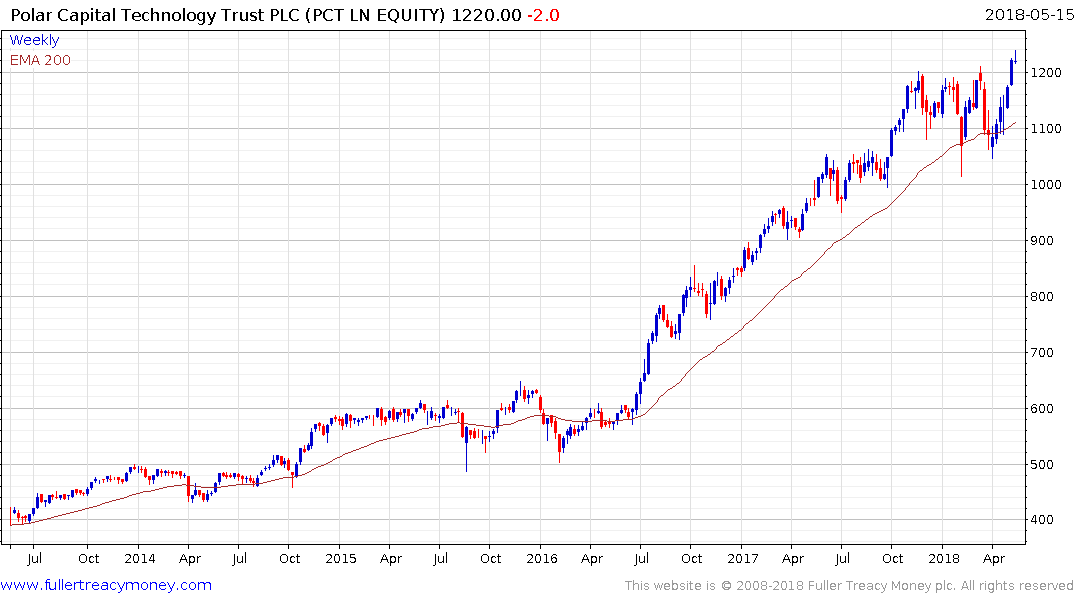
The Polar Technology Trust (PCT UK) now trades at a discount of 1.88%. It broke out to new highs last week and improved upon that performance this week. A clear downward dynamic would now be required to question medium-term scope for additional upside.
If I am in fact correct that the decades long period of global disinflation is ending then Japan is one of the places most likely to benefit since they have been chasing inflation for so long. That suggests some exposure to Japan in one’s portfolio is likely to be beneficial. The Dollar’s rally over the last six weeks has resulted in it retesting the ¥110 area against the Yen. This is a natural area for some reassessment but the odds of continues Dollar dominance are improving.
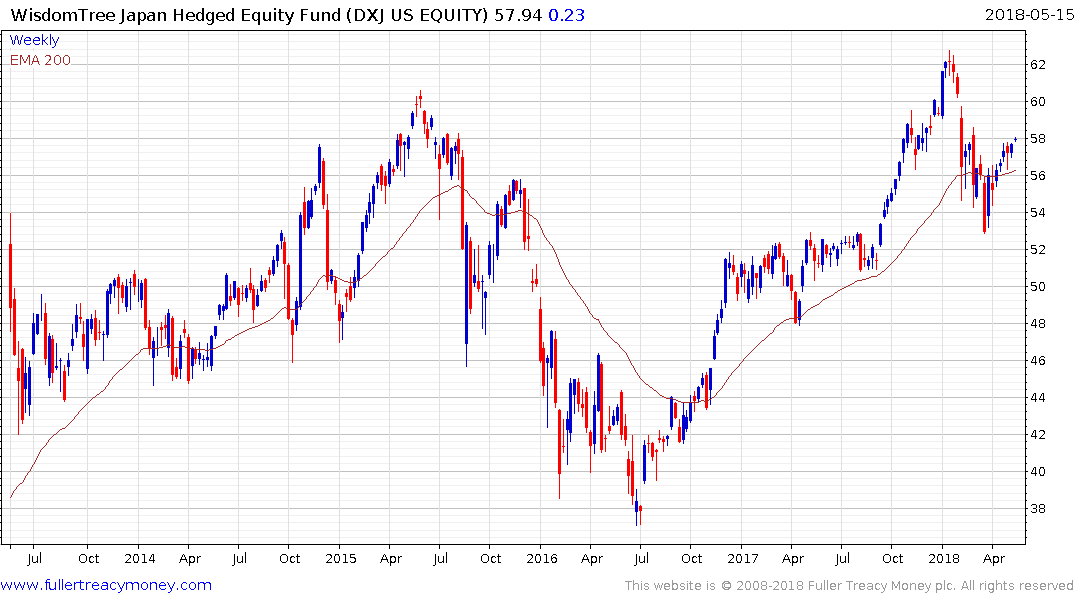
Hedged exposure to the Japanese market is available via the Wisdomtree DXJ ETF in the US, the similar UK fund is IJPH.
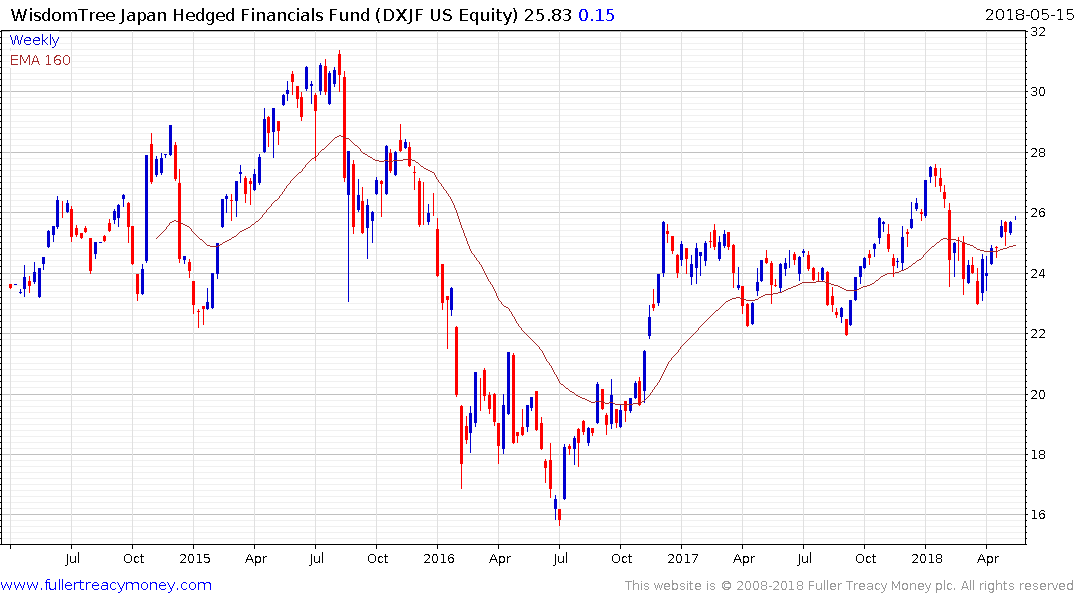
In particular the Banking sector has been depressed but is a high beta play on rising inflationary expectations. DXJF is a US listed US Dollar hedged ETN focusing on the Japanese banking sector.
We originated the term Autonomies for globally oriented companies that dominate their respective niches, benefit from the trend of capitalism towards consolidation and from the growth of the global consumer, energy revolution and technology innovation. The universe of shares I identified as Autonomies in 2012 can be found through this section of the Chart Library. You will notice that the shares represent a cross section of truly global operations with high growth and dividend aristocrats both present. They all share the commonality of dominating their respective niches on a global basis.
One of the other reasons we focused on internationally oriented companies is because we believed they could offer some of the best hedges against inflation. That is particularly true of consumer staples type companies with deep international brand recognition. However, the bond-like qualities of their cash flows have led to them coming under selling pressure as bond yields have become more competitive. The onus is now on these companies to increase their dividends at a faster rate to improve their allure for investors.
At the present moment the Autonomies are being traded as if they all bear the same risk from protectionism. That is not the case but it will likely take time for investors to be willing to differentiate.
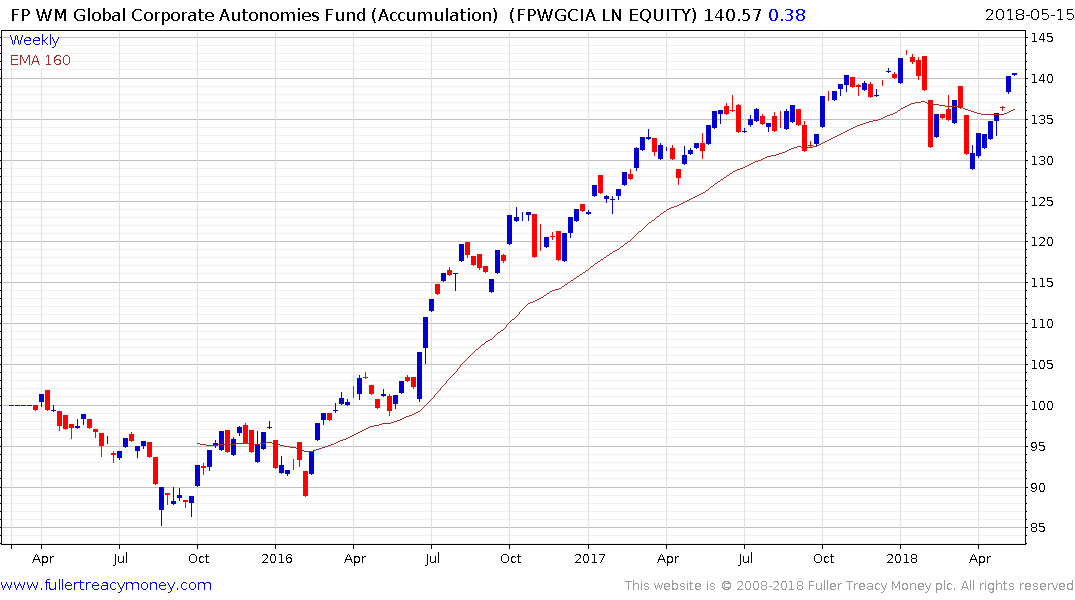
I co-manage a UK listed OIEC which runs an equal weighted strategy and rebalances once every quarter into the 100 with the most attractive chart patterns and relative performance. It has a management fee of 0.55%. We tilted the focus of the fund to as defensive as the mandate allows at the end of the last quarter.
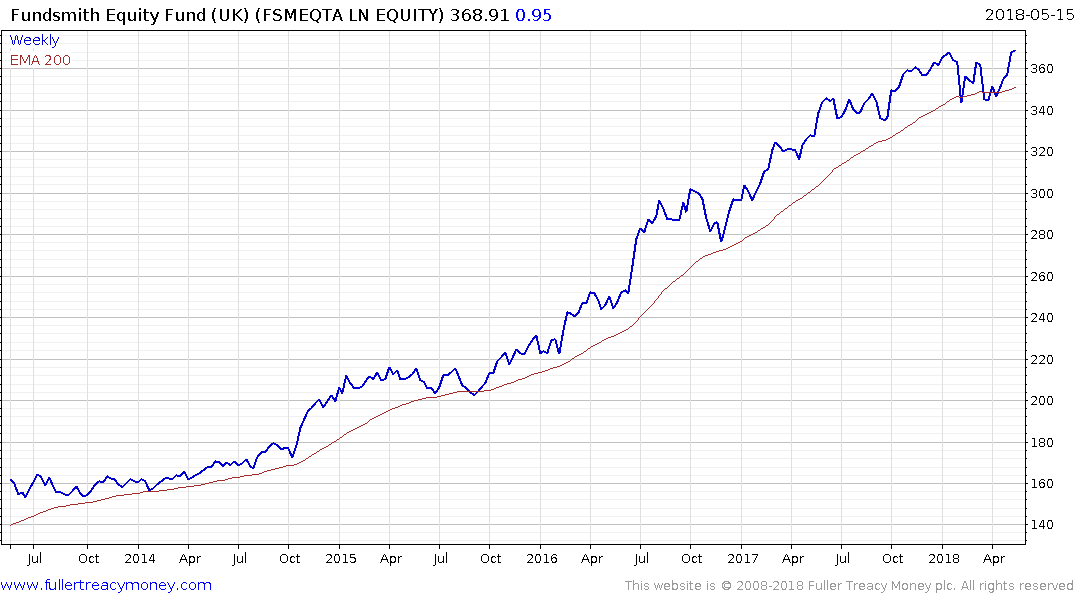
The UK listed Fundsmith Equity Fund also invests in global themes but on a more concentrated and active basis and charges 1%.