
Long-term themes review March 7th 2018

FullerTreacyMoney has a very varied group of people as subscribers. Some of you like to receive our views in written form, while others prefer the first-person experience of listening to the audio or watching daily videos.
The Big Picture Long-Term video, posted every Friday, is aimed squarely at anyone who does not have the time to read the daily commentary but wishes to gain some perspective on what we think the long-term outlook holds. However, I think it is also important to have a clear written record for where we lie in terms of the long-term themes we have identified, particularly as short-term market machinations influence perceptions.
Here is a brief summary of my view at present.
I believe we are in a secular bull market that will not peak for at least another decade and potentially twice that. It is being driven by technological innovation especially in the energy and healthcare sectors which have the potential to deliver productivity growth over the long term.
The best graphic illustration we have for the cyclical nature of stock market performance is the Dow/Gold ratio because we have more than 100 years of history. There has been an average of 35 years between major stock market peaks and last major peak for the ratio was in 1999 so that suggests we are about half way through this secular bull market for stocks versus gold. There has never been a long-term secular bull market that has not been punctuated by the occasional recession but these have generally been buying opportunities from the perspective of long-term investors.
So, the big question many people have is if we accept the bullish hypothesis how do we justify the second half of this bull market based on valuations where they are today? Technological innovation is going to get us a good part of the way and we already have plenty of evidence of that. However, the answer is also going to have to include inflation. If the inflation crises in Argentina and Venezuela have taught us anything, it is that the stock market reflects the inflation rate.
One of the things many people worry about is that inequality has become a structural issue for a lot of countries. When credit is abundant and economies and wages are growing they paper over a lot cracks in the social infrastructure. The advent of both globalization and technological innovation have been highly disinflationary, while also creating an environment where the emerging markets have flourished. At the same time offshoring and greater competition have resulted in large numbers of disaffected workers in the rust belts of major economies. These communities, which were once the bedrock of the economy are now riven with unemployment, declining standards of living and drug abuse. In democracies that condition is unsustainable which is giving rise to reactionary parties for people all over the world who ask “What about me?” Rather than characterise this movement as populist, xenophobic, anti-immigrant or racist I believe it is more correct to view them as symptoms of a wider revolt against the status quo. The answer to the question “What about me?” is “Here, have some money” That decision to embrace appeasement rather than tackle the basic structural issue is highly inflationary.
.png)
.png)
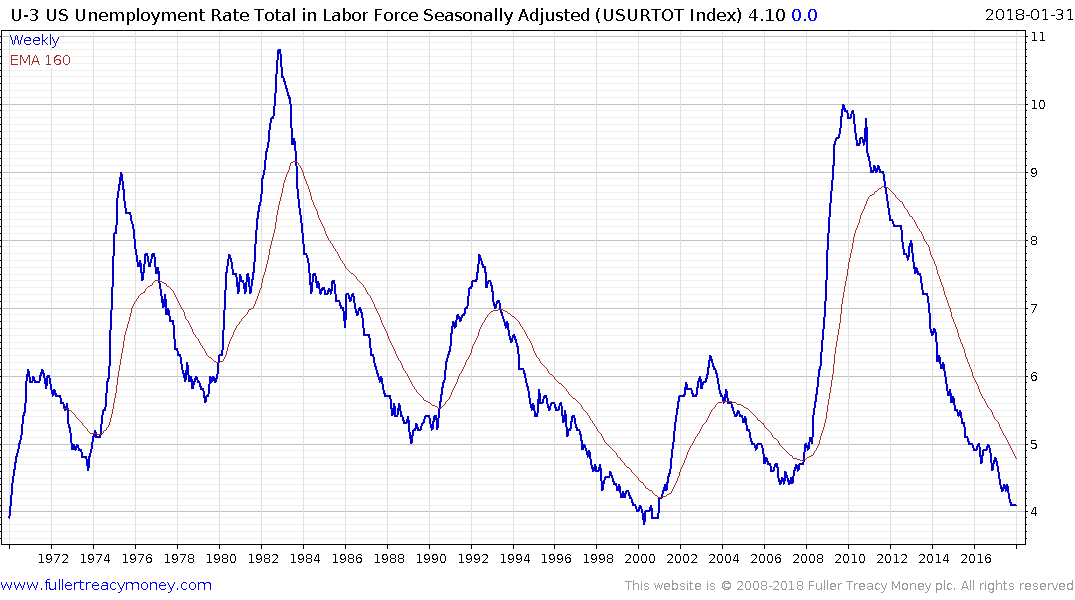
Interest rates are beginning to rise as the global economy transitions from synchronized monetary expansion to economic expansion. The introduction of deficit spending, dressed up as fiscal stimulus, in the USA has the potential to foment inflation. With the Federal Reserve buying fewer bonds and the Treasury issuing more of them, it is logical that yields will rise further over the medium-term. That is likely to be the causal factor behind the next recession but the lead indicators for recessions such as the yield curve spread, unemployment or high yield spreads do not suggest a recession is imminent.
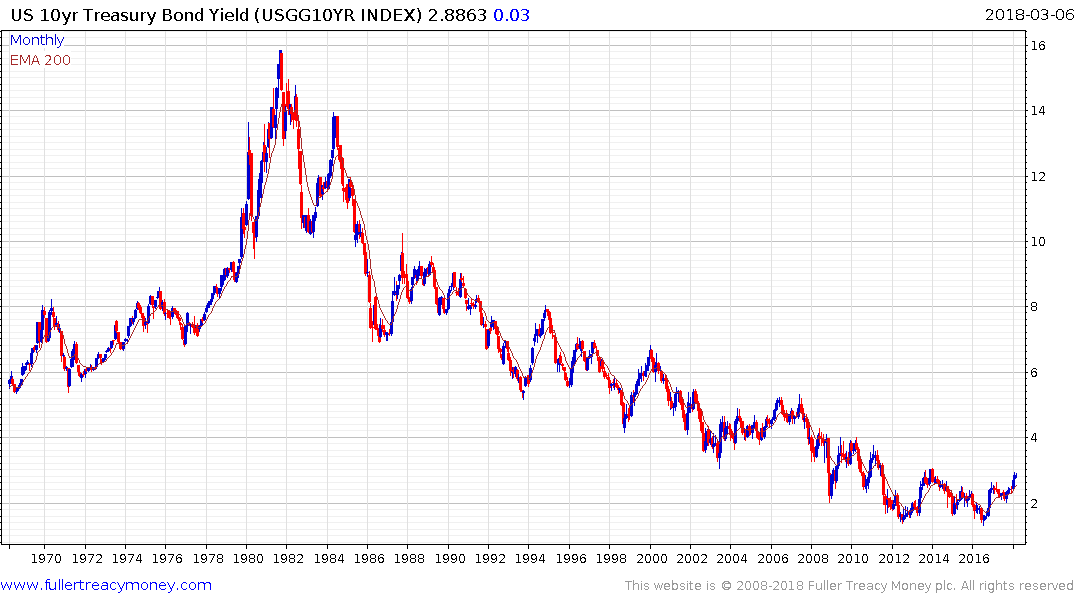
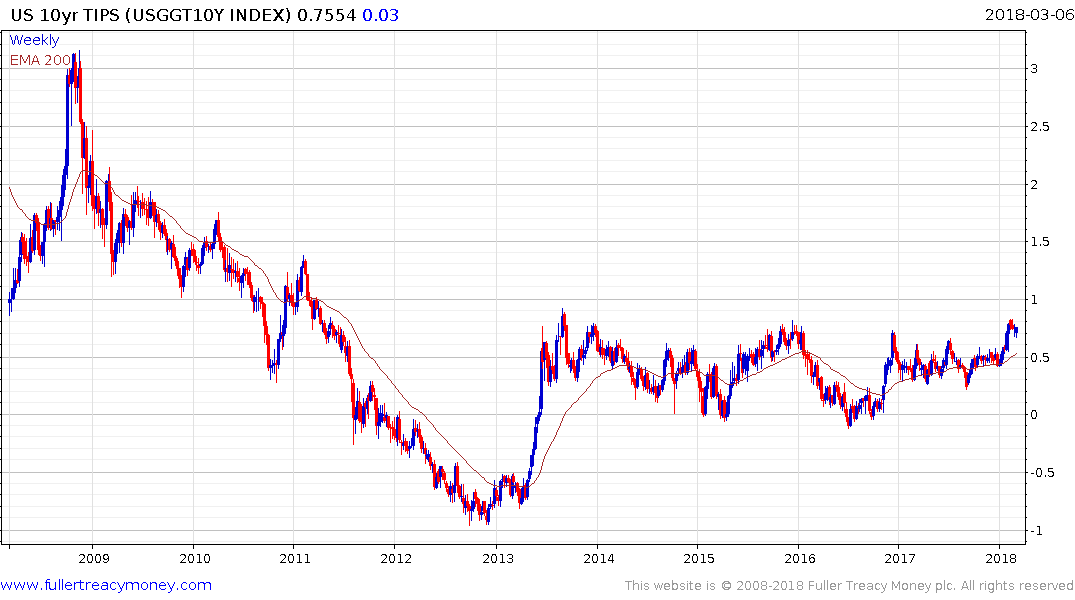
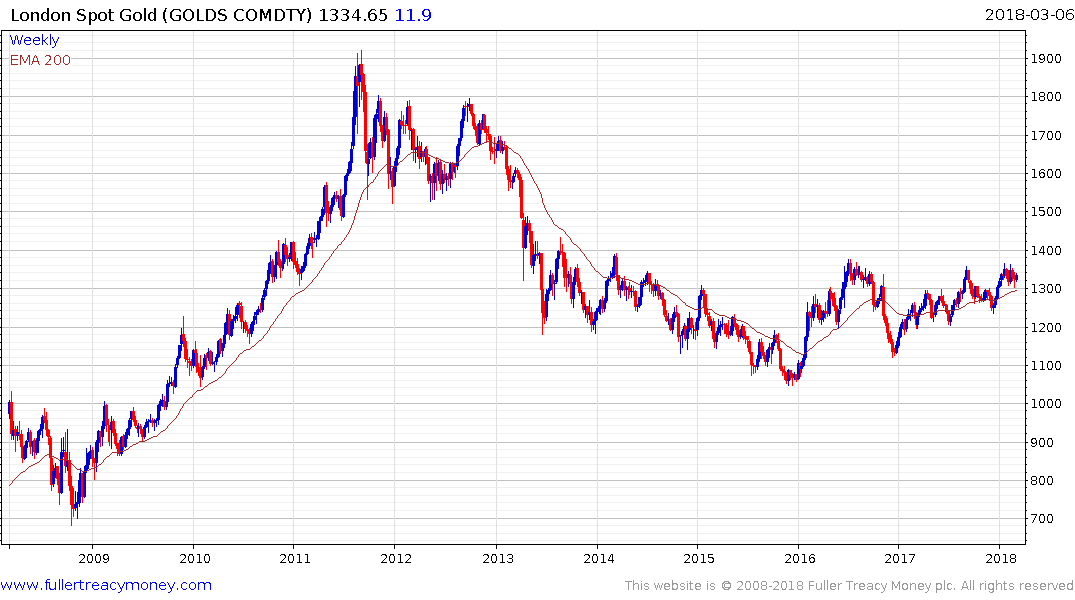
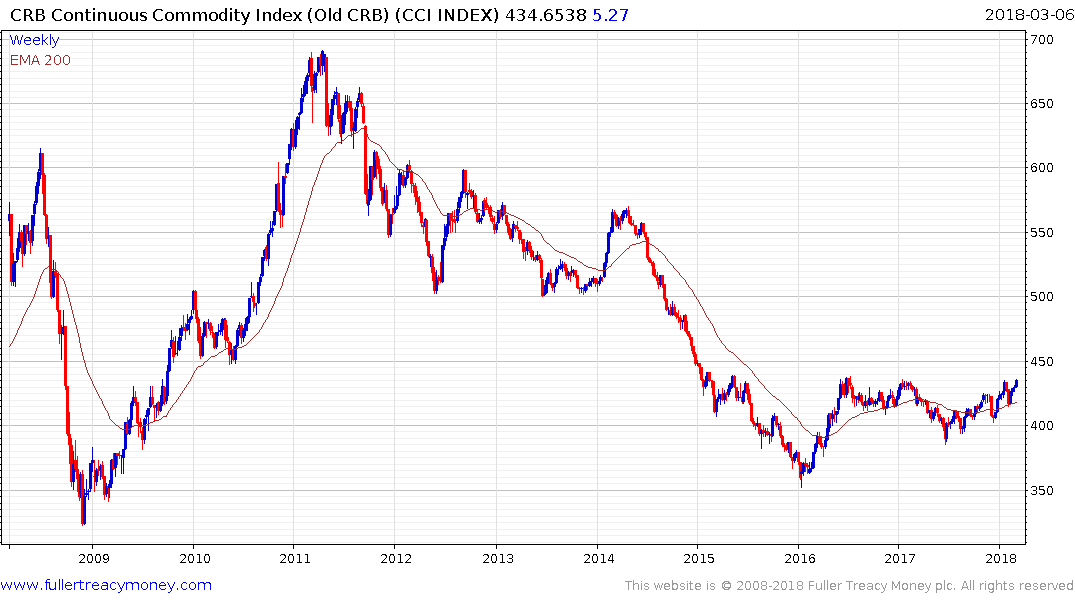
Treasury yields have been in a base formation since 2013 and arguably since 2011. TIPS yields have been ranging below 80 basis points since 2013. Gold has been forming a saucering pattern below $1400 since 2013, The Continuous Commodity Index has been ranging below 440 since 2016. Every one of these charts is a range and we describe ranges as explosions waiting to happen. The fact they all respond to rising inflationary pressures by moving higher should be a warning to anyone who looks at charts that inflation could come back with a bang this year.
The introduction of the possibility of trade wars is a new consideration which is an additional symptom of the reaction against the status quo. We are still in the very early stages of this threat but if it develops into a series of tit for tat measures it is unlikely to be positive for stock markets and will be contributing factor in rising inflationary pressures.
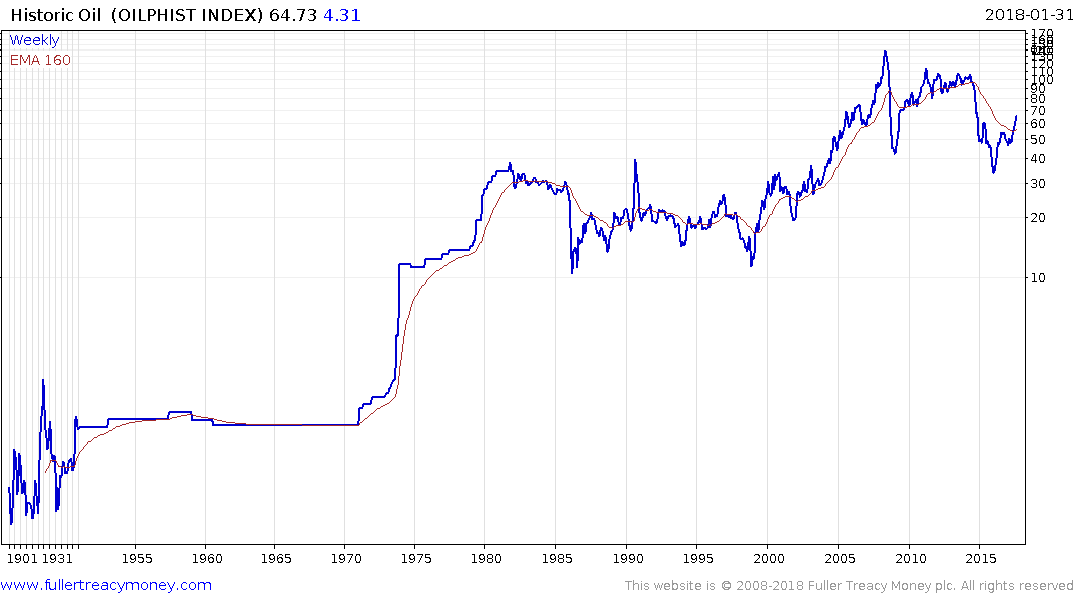
Energy prices, represented by oil, tend to move in long-term bull and bear market cycles. We’ve had an impressive bull market and now we are in another lengthy ranging phase which could last another decade. My working hypothesis at present is that $70 represents the point at which additional new supply is brought to market so is therefore where prices encounter resistance in the absence of clear geopolitical stress. At the other side of the range $40 and below is where supply is withdrawn from the market.
Technological innovation is working its way through the energy sector as unconventional supply moves mainstream. Concurrently battery manufacturing scale and better chemistries continue to reduce costs while governments are mandating increasing demand. That represents a significant headwind for the oil sector over the medium to long-term, but it removes a headwind to growth for oil consumers.
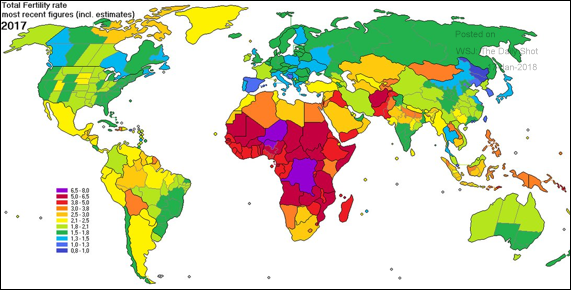
Improving governance, capitalism and globalisation have lifted billions of people in the emerging markets out of abject poverty and into the middle classes. This is contributing to productivity gains which is driving growth in the world’s major population centres. The global population is expected to expand by an additional 2 billion people within the next 20 years and the majority of those people are going to be in Africa. Considering the evidence, we already have that technology both promotes growth and detracts from it, the only way Africa is going to emerge to the point where individual countries can reach their productive capacity is through improving governance.
With a continent the size of Western Europe and North America combined there are going to be both success stories and failures so it is important to remember that standards of governance are not an absolute. It is the trajectory that is important. We need to ask ourselves whether conditions are improving or deteriorating. Dumping Zuma was a major step forward for South Africa while Ethiopia’s single party government clamping down on protests can be viewed as a retrograde step.
There was news today that China’s economy is about to overtake the Eurozone’s in size. That is a major achievement for China but at the same time we cannot ignore the fact that the country is regressing in terms of standards of governance. Any semblance of differentiation between the Party and private enterprise is being eroded and the trend is accelerating. The only logical conclusion is that standards of governance will deteriorate when the profit motive is overtaken by the interests of the Party. That does not mean the market is about to implode but it represents a growing risk rather than a receding risk and therefore China deserves a higher risk premium now than it did a year ago.
Elsewhere there is ample evidence of improving standards of governance delivering on productivity growth not least in ASEAN and India which remains on secular, albeit volatile growth trajectories.
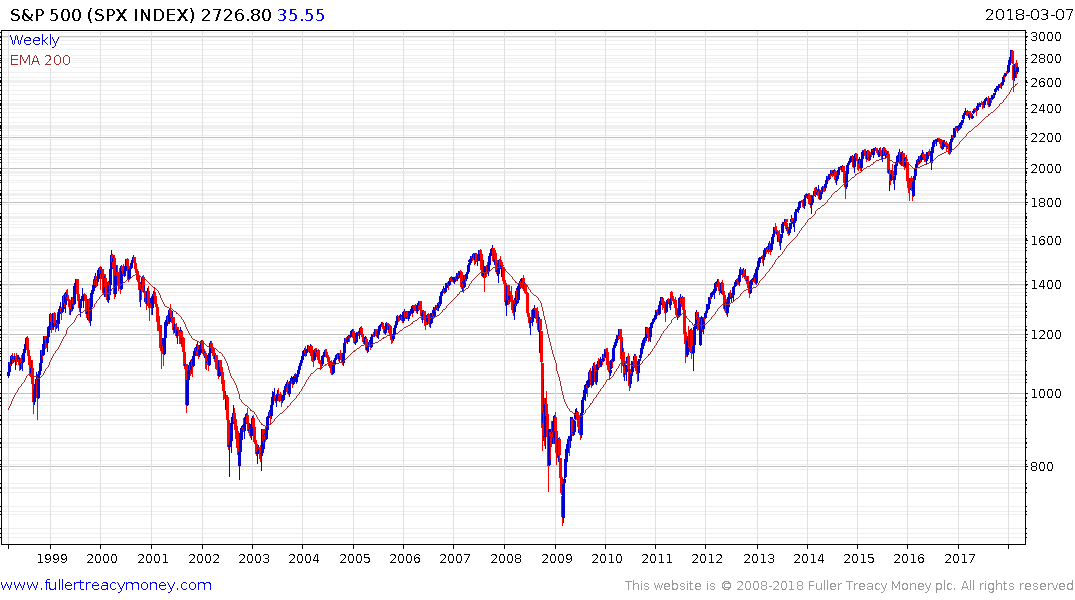
However, we are simultaneously in the later stages of a cyclical bull market that began in late 2008/early 2009. There is increasing evidence of the third psychological perception stage of a bull market which often climaxes in acceleration. There has been ample evidence of acceleration in the six months up to the January peak and the sharp drawdown in early February saw the first signs of deleveraging with the implosion of short volatility and associated options strategies. Wall street has now seen peaks of at least medium-term significance and the best-case scenario is for ranging for the next few months. So far that ranging has had an upward bias. The sectors leading the way out of this corrective phase are primarily in the technology sector and share the commonality of having adopted a subscription model which tends to smoothen out cash flows.
Generally speaking it is in the latter stages of a cyclical bull market that cyclical sectors outperform. Mining, energy, banking and biotechnology all fall into that category because they are all leveraged to global growth and access to liquidity.
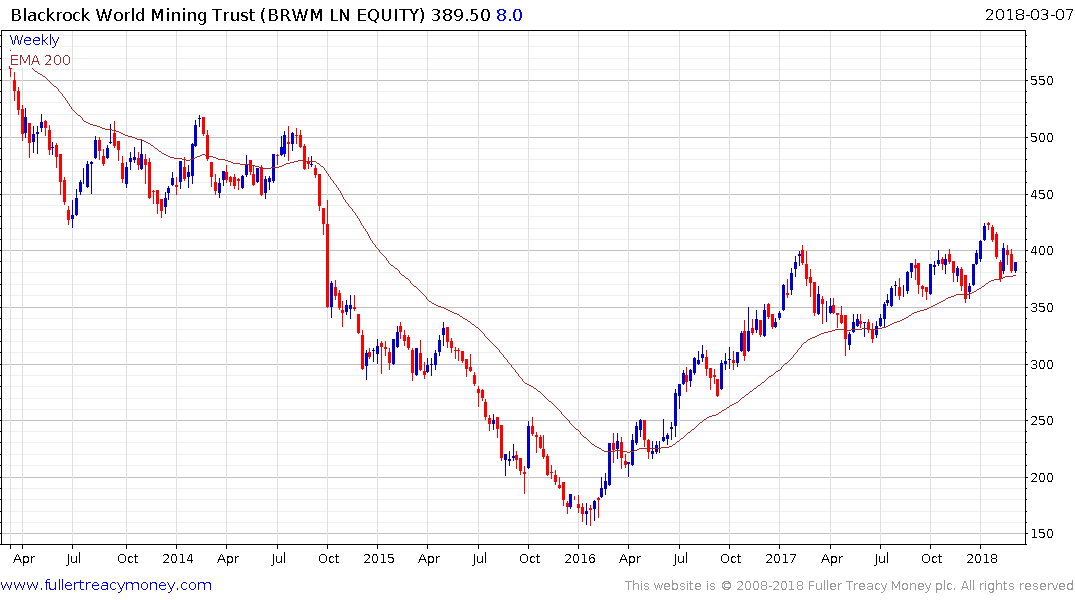
The BlackRock World Mining Trust is trading at a discount to NAV of 9.08% and has fallen back to test the region of the trend mean where it is now firming. It will need to hold the 375p area if medium-term scope for continued higher to lateral ranging is to be given the benefit of the doubt.
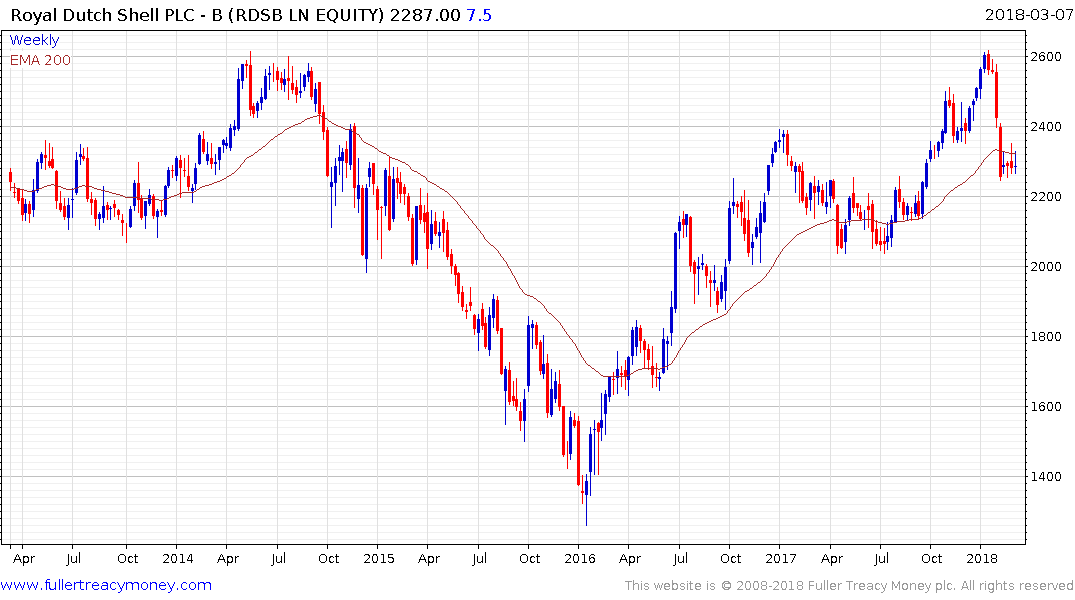
Royal Dutch Shell’s pivot to natural gas production more than a decade ago and increasing focus on that sector continues to pay dividends and the share yields 6.2%. It is now trading in the region of the trend mean and will need to continue to hold that area if potential for continued higher to lateral ranging is to be given the benefit of the doubt.
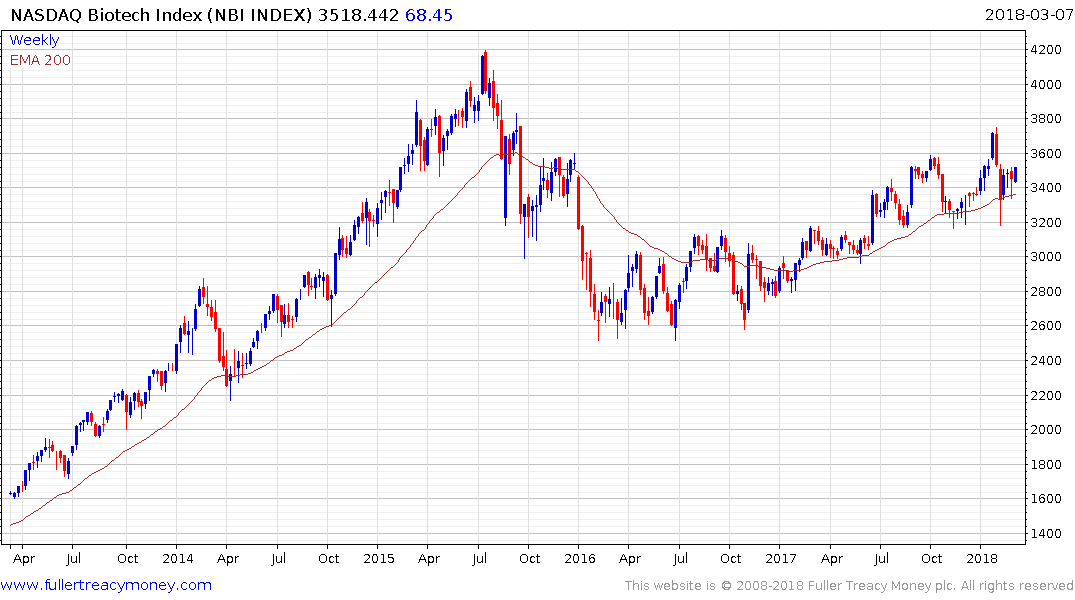
The iShares Biotechnology ETF (IBB or SBIO in the UK) is now firming from the region of the trend mean. However, the long-term outlook for biotechnology remains very positive. As quicker, cheaper and more detailed genetic testing, editing and synthesising reach commercial utility, the convergence of these technologies has the potential to deliver truly personalized medicine.
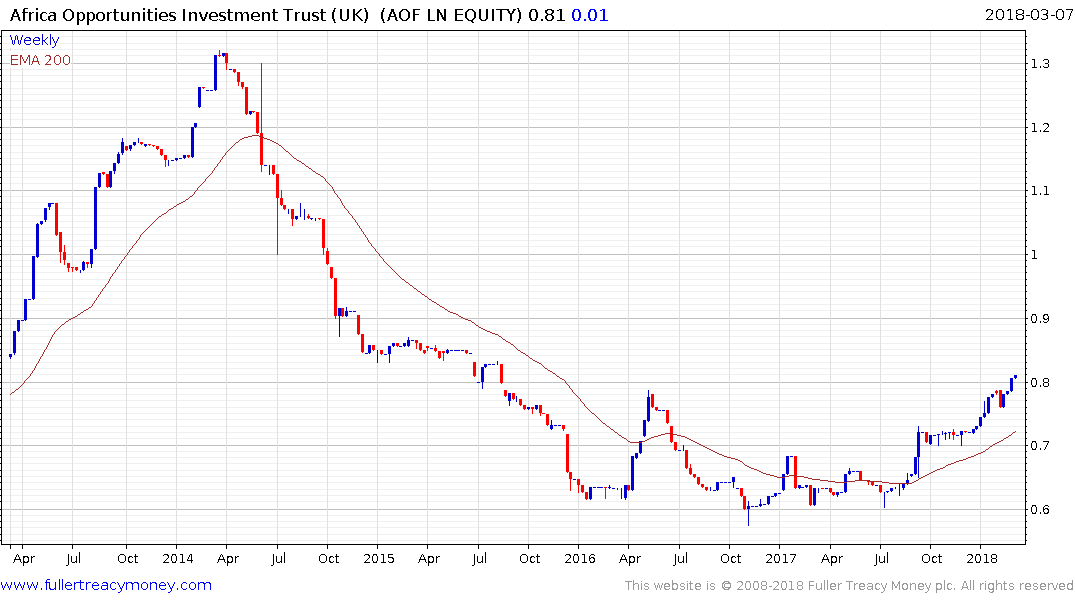
The Africa Opportunities Trust (AOF LN) broke out to new recovery highs last week and as a cyclical sector also has potential to perform in the latter stages of a medium-term bull.
Longer term, India remains one of our favourite markets. The Rupee has stabilized and the rollout of 4G to the whole country, combined with the completion of the nation’s biometric data collection efforts, suggest India is on the cusp of a digital growth phase that could help drive outpaced economic expansion for the foreseeable future. Nevertheless, India does not exist in a vacuum and trade wars could weigh on the market in the short term.
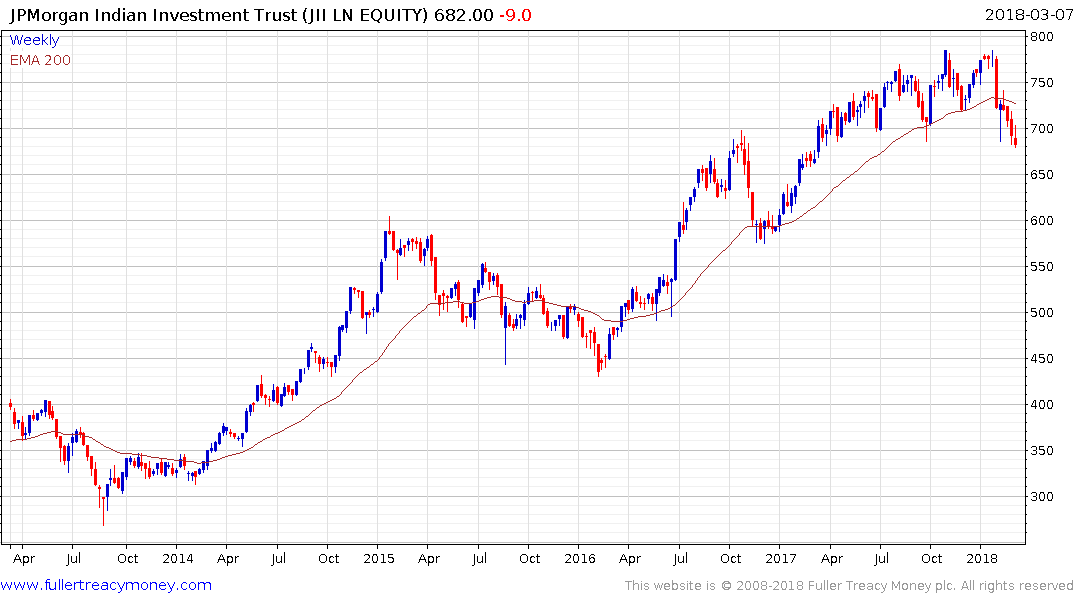
The JPMorgan India Investment Trust trades at a discount to NAV of 13.11% and has pulled back below the trend mean and will need to rally soon if medium-term top formation completion is to be avoided.
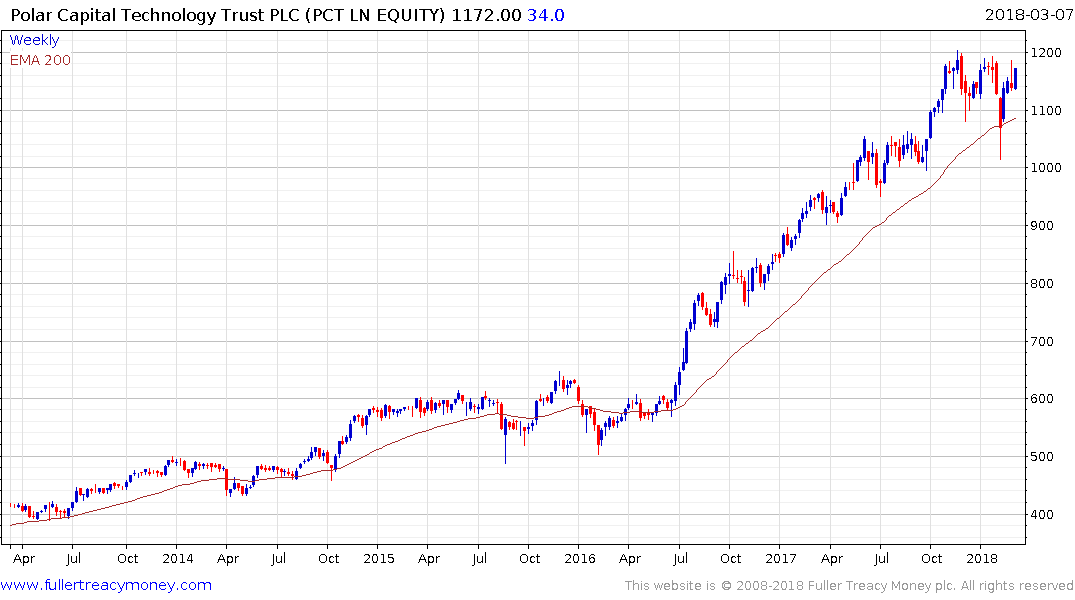
The Polar Technology Trust (PCT UK) now trades at a discount of 2.2%. It has firmed from the region of the trend mean and is back testing its peak. A sustained move above 1200p, however, will be required to confirm a return to demand dominance. If a rotation is truly underway it is reasonable to expect technology to underperform at the expense of cyclical sectors.
If I am in fact correct that the decades long period of global disinflation is ending then Japan is one of the places most likely to benefit since they have been chasing inflation for so long. That suggests some exposure to Japan in one’s portfolio is likely to be beneficial.
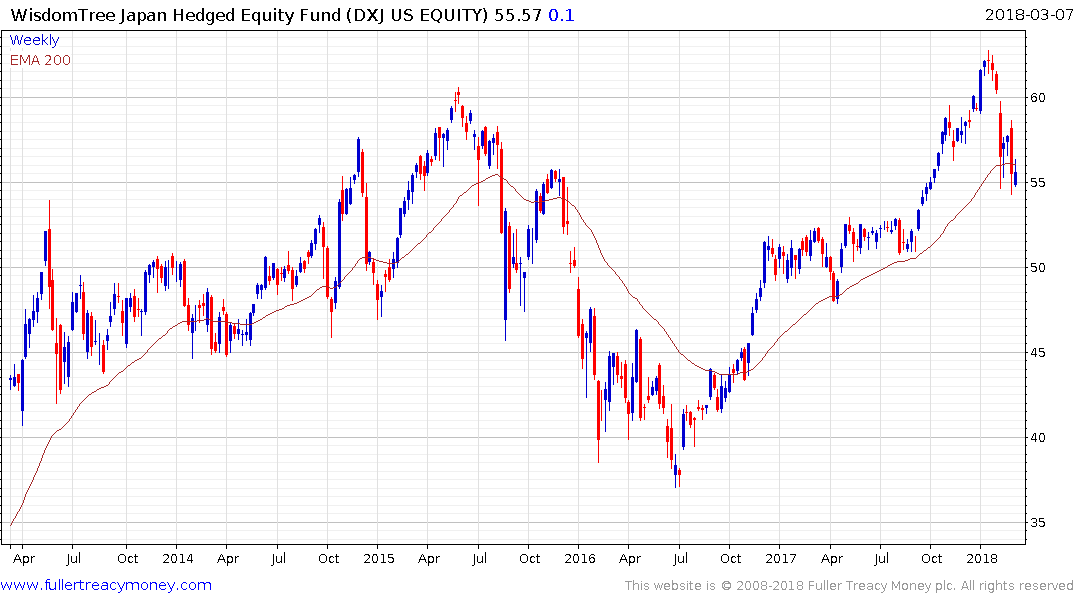
Hedged exposure to the Japanese market is available via the Wisdomtree DXJ ETF in the US, the similar UK fund is IJPH. These funds are currently trading in the region of their respective trend means.
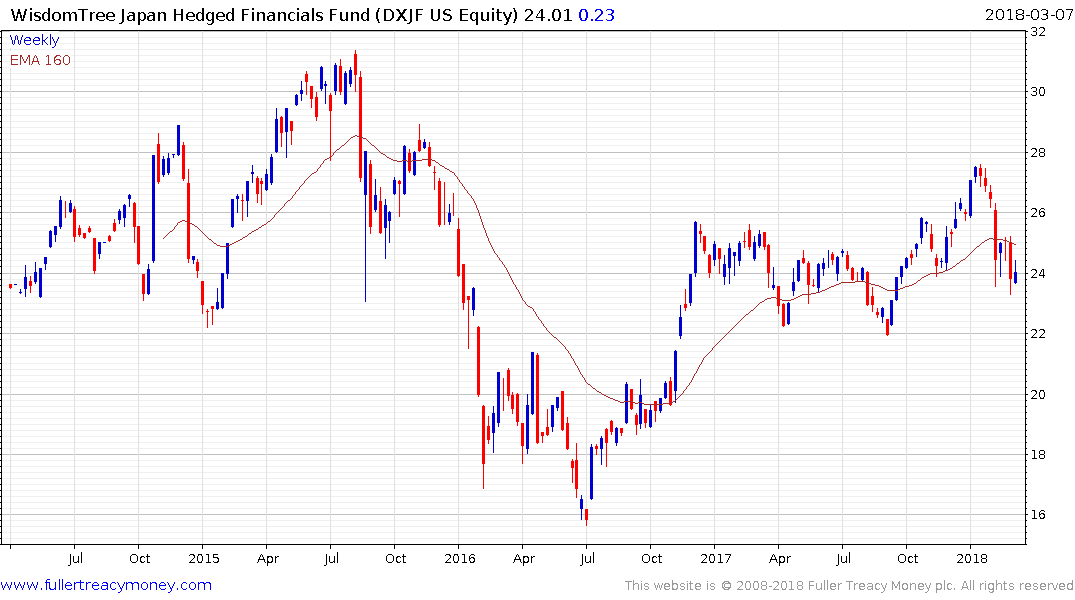
In particular the Banking sector has been depressed but is a high beta play on rising inflationary expectations. DXJF is a US listed US Dollar hedged ETN focusing on the Japanese banking sector.
We originated the term Autonomies for globally oriented companies that dominate their respective niches, benefit from the trend of capitalism towards consolidation and from the growth of the global consumer, energy revolution and technology innovation. The universe of shares I identified as Autonomies in 2012 can be found through this section of the Chart Library. You will notice that the shares represent a cross section of truly global operations with high growth and dividend aristocrats both present. They all share the commonality of dominating their respective niches on a global basis.
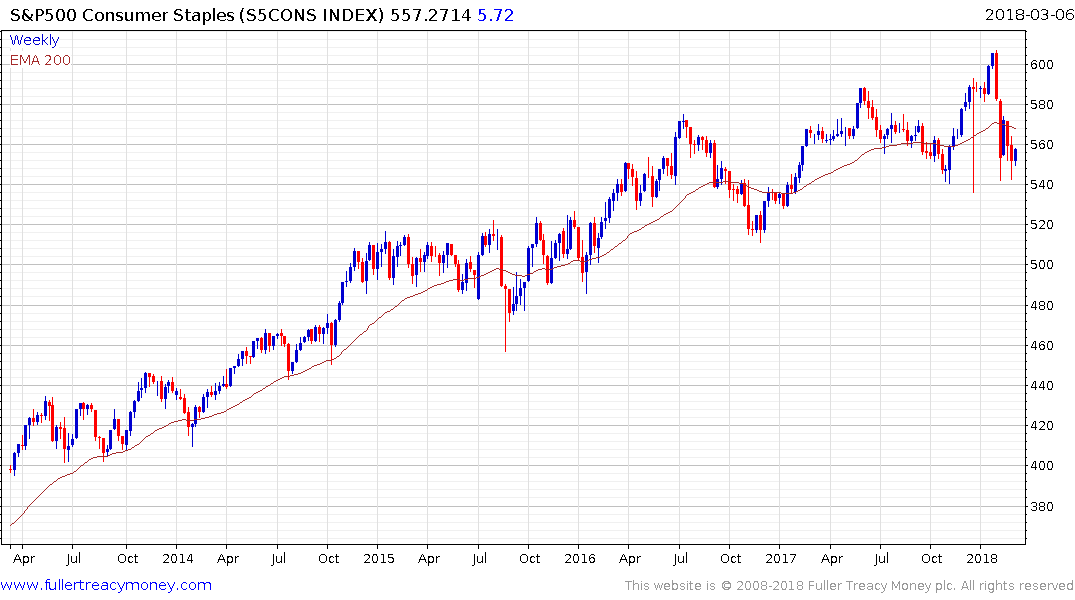
One of the other reasons we focused on internationally oriented companies is because we believed they could offer some of the best hedges against inflation. That is particularly true of consumer staples type companies with deep international brand recognition. However, the bond-like qualities of their cash flows have led to them coming under selling pressure as bond yields have become more competitive. The onus is now on these companies to increase their dividends at a faster rate to improve their allure for investors.
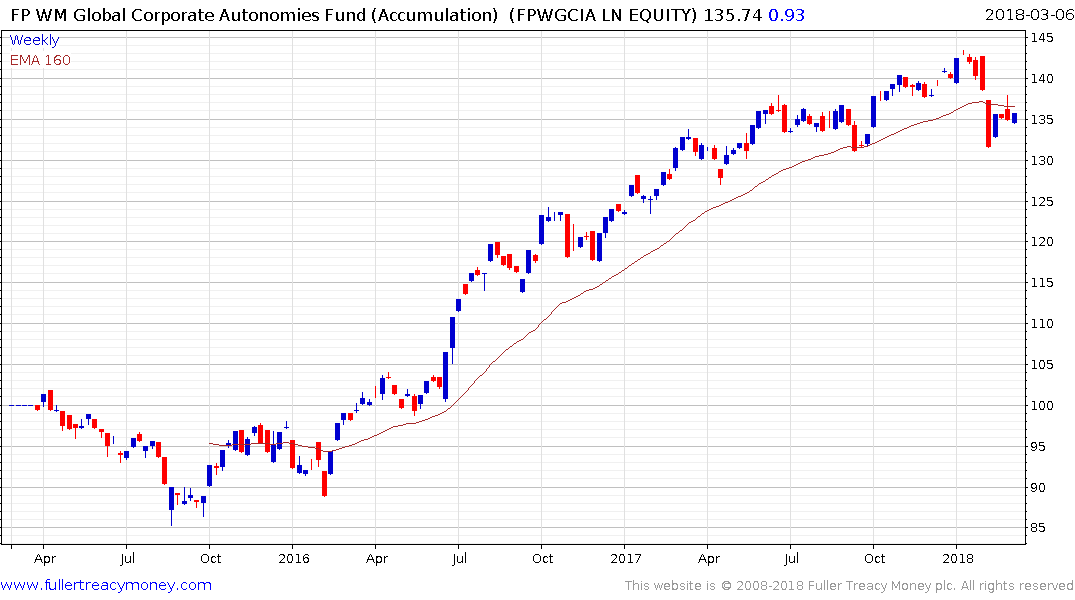
I co-manage a UK listed OIEC which runs an equal weighted strategy and rebalances once every quarter into the 100 with the most attractive chart patterns and relative performance. It has a management fee of 0.55%.
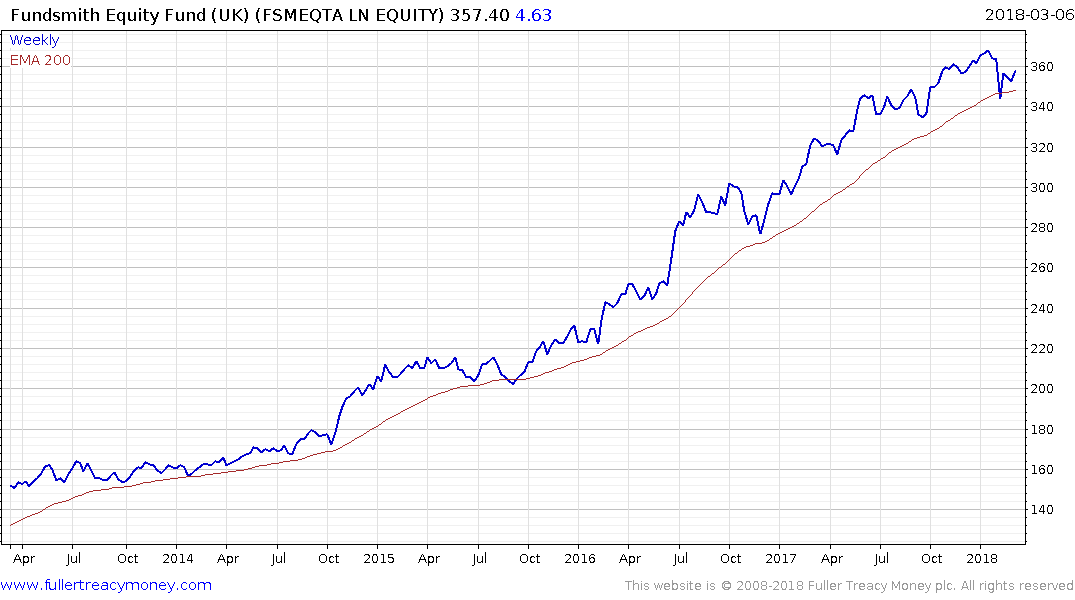
The UK listed Fundsmith Equity Fund also invests in global themes but on a more concentrated and active basis and charges 1%.