
Entering The Superbubble's Final Act
Thanks to a subscriber for this article by Jeremy Grantham. Here is a section:
My theory is that the breaking of these superbubbles takes multiple stages. First, the bubble forms; second, a setback occurs, as it just did in the first half of this year, when some wrinkle in the economic or political environment causes investors to realize that perfection will, after all, not last forever, and valuations take a half-step back. Then there is what we have just seen – the bear market rally. Fourth and finally, fundamentals deteriorate and the market declines to a low.
Let’s return to where we are in this process today. Bear market rallies in superbubbles are easier and faster than any other rallies. Investors surmise, this stock sold for $100 6 months ago, so now at $50, or $60, or $70, it must be cheap. Outside of the late stage of a superbubble, new highs are slow and nervous as investors realize that no one has ever bought this stock at this price before: so it is four steps forward, three steps back, gingerly exploring terra incognita. Bear market rallies are the opposite: it sold at $100 before, maybe it could sell at $100 again.
The proof of the pudding is the speed and scale of these bear market rallies.
1. From the November low in 1929 to the April 1930 high, the market rallied 46% – a 55% recovery of the loss from the peak.
2. In 1973, the summer rally after the initial decline recovered 59% of the S&P 500's total loss from the high.
3. In 2000, the NASDAQ (which had been the main event of the tech bubble) recovered 60% of its initial losses in just 2 months.
4. In 2022, at the intraday peak on August 16th, the S&P had made back 58% of its losses since its June low. Thus we could say the current event, so far, is looking eerily similar to these other historic superbubbles.

Have we seen the secular peak in this market? That’s the only real question investors need to concern themselves with. The above statistics are certainly compelling, but the size of the rebounds should also be considered relative to the size of the initial declines from the peaks. Let’s round out that data.
1. The Dow Jones Industrials Average accelerated to the peak on September 3rd 1929. It fell 47.87% to the initial low on November 13th
2. The peak in 1973 was a failed upside break from a range that had been forming since 1966; with the Dow failing at the psychological 1000 on several occasions. That failed upside break resulted in a deeper pullback than any (25% & 36%) posted during the ranging phase. The failed downside break in 1974 resulted in a 75% rebound. It was another six years before a breakout to new highs was sustained.
3. Between March 10th and May 26th 2000 the Nasdaq Composite fell 40.72%.
4. Between January 7th and the low on June 17th the S&P500 declined 24.52%.
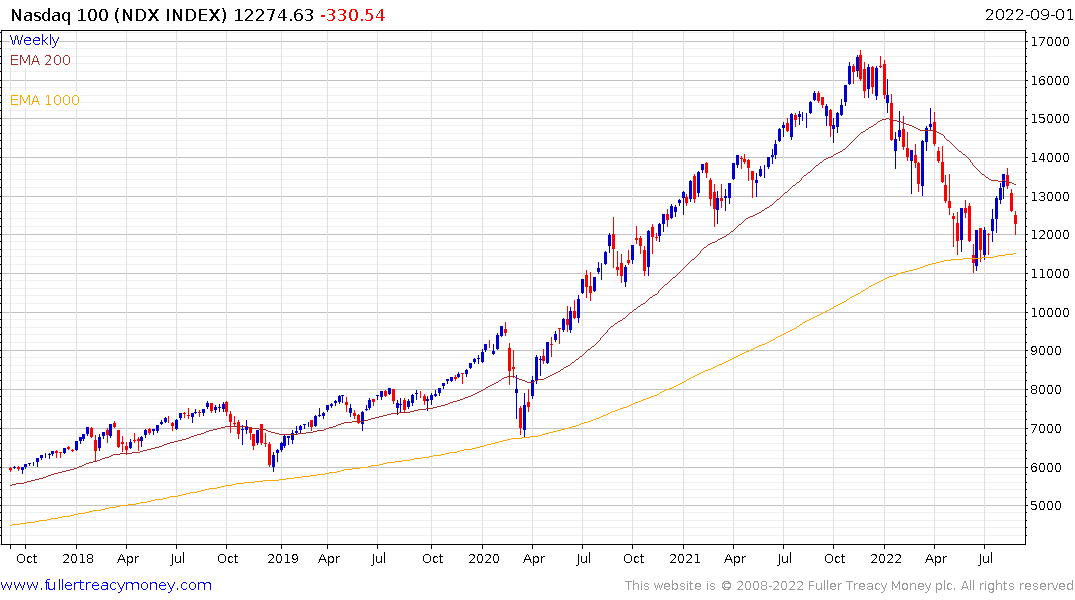
Relative to the size of the initial declines discussed above, the 2022 experience is modest by comparison. The Nasdaq-100 certainly pulled back more (34%). The biggest factor this year has been correlation between bonds and equities. When both sides of a “diversified” portfolio decline it introduces a great deal of stress to asset management teams and creates a sense of desperation.
I enjoyed an after tennis beer last night with some friends that gave me a lot of perspective. The COO of a major PR/marketing firm, whose clients are all household name consumer brands, reported business declined for about six weeks in 2020. Within three months it had hit new all-time highs, 2021 was even better and 2022 is even better. He said “I see no slowdown in marketing spend”.
An engineer at a consumer electronics design company reported the problem is no longer with chips, it is with components that go with them. He said they have spent the last two years redesigning products to cut out reliance on out of stock parts. The components, when they are available, are priced at thousands of percent above where they were before the pandemic. ($0.10 to $4).
It’s not just about the pandemic, there have been fires at several factories, (Germany, Japan and China, China) that knocked out supply. The constant on again/off again of Chinese manufacturing, because of covid-zero lockdowns, is another headache.
This helps to highlight the polarity of the current economic environment. The consumer electronics sector is still contending with serious supply chain issues. Some of these are about demand but others rely on factory capacity increases.
It’s a difficult environment to navigate and is resulting in capital investment similar to that seen during the Y2K mania. That’s highlights in bold terms how cyclical the semiconductors sector it. Prices of components will collapse when new supply comes online, but that might take a couple of years.
Meanwhile, abundant liquidity, full employment and robust spending are supporting consumer brand revenues. That’s true even as they approach the limit of how easily they can pass on higher costs to buyers.
The stock market is dominated by the companies that make the best use of cheap capital. Layoffs are rising in this sector, but they are not generally large employers. Snap, for example, is firing 20% of its workforce of 6000 people. Nvidia and AMD do not have their own factories and so do not have large workforces (22,500 & 15,500 respectively). These kinds of layoffs are not going to move the needle on unemployment, but are a lead indicator for tighter liquidity conditions.
The Fed only has two mandates, full employment and price stability. They have full employment and not price stability. Until both mandates are wobbling, they will continue to tighten.
The fact is the Fed cannot do it alone. Government needs to contain spending increases and adopt balance budget proposals to get inflation under control. There is no political will to do that anywhere. In the USA, President Biden’s decree to forgive $300 billion in student loans is certain to meet with legal objections but is indicative of sentiment. Liz Truss saying whatever is required to win the Tory leadership content (No new taxes) is going to be tested before long.
The question of whether inflation is a sustained trend is going to hinge of China. Lockdowns are expanding across the major population centres as covid-zero policies go into overdrive ahead of the Communist Party Congress next month. The housing crisis continues to intensify and measures to inject liquidity has been modest at best.
If China goes through a liquidity crisis, it will have knock-on effects everywhere. That would collapse commodity prices and reset many of the inflationary pressures currently making headlines. On the other hand, if China goes for the same liquidity rescue plans the USA did following its property crash, inflation is going to be a sustained global trend.
Sovereign yields are rising everywhere except China. That implies the risk of deflation is highest in China at present.
If this is the end of a mania, we are only at the beginning of significant valuation contraction. It implies record corporate profits will not be sustained and turnover will also fall. That would push up valuations from current somewhat pricey levels.
This bull market has been liquidity fuelled since 2008. In that 14 years, liquidity from China, Europe or the USA has supported asset prices during every correction. That has supported prices for everything from collectibles, cryptocurrencies, property, fixed income, equities and private assets. Right now, there is no evidence to suggest central banks are willing to wade in and support asset prices. Until that changes we should give the benefit of the doubt to the downside.
Sustained moves below the 1000-day MA, and clear underperformance of supply-decline lines is required to confirm secular top formaiton completion.
Back to top