
Email of the day on looking at lots of charts
Dear Eoin, In the 1960s and 1970s subscribers to the David Fuller Chart Service received a booklet containing hundreds of charts each week or each month. I used to come into the office at 6a.m. and complete the point and figure charts each day. Thanks to this work, I gained a reputation among my colleagues for being the first one to spot changes in the long-term trends of both overall markets, sectors and individual shares. As of this morning, I am getting up one hour earlier and I will start by looking at all the daily charts of the Autonomies in the Chart Library. Let's hope that this will produce the same result. This morning's work show very small blue upward marks in almost every chart. These are tiny upward movements in the year-long major decline in all these share prices. This "summer's swallow" has not yet started chirping. Regards,

Thank you for this account. David was still having chartbooks printed in 2003, when we began working together. By that stage they were a very niche product that had become obsolete with the development of charting software. Nevertheless, the practice of looking at lots of charts is as useful today as it has ever been.
In following your program of activity, I would suggest taking one day to look at point and figure charts. They will give you clear confirmation of a change of trend.
Monday was the first trading day of the fourth quarter. 2022 has been a year where bonds, equities and currencies, other than the Dollar, have all fallen together. If money managers are going to rescue their performance for the year, they will need to make money in the next 90 days. So far, the quarter is off to a good start.
To fuel this rebound, one needs to believe the interest rate hiking cycle is close to an end and boom times will return. The RBA raised by 0.25% today instead of the expected 0.5% so that was used as a justification for the belief we are close to the end of tightening elsewhere too.
The sensitivity of markets like the UK, Australia and Canada to both floating rate mortgages and the absolute high price points restricts the ability of their central banks to raise rates aggressively. I’m reticent to apply the same logic to the USA.
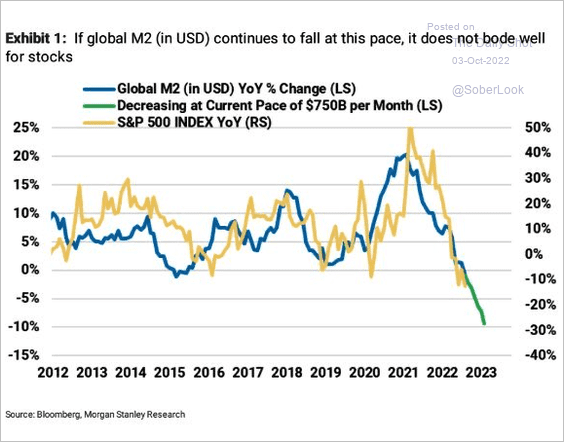 This chart from Morgan Stanley helps to highlight that tightening has not only been about raising rates but also restricting money supply growth. My sense is we are due a rebound from deep short-term oversold conditions and evidence for that was provided over the last two sessions with some impressive rebounds.
However, concern with inflation could very easily transform into deflationary fears as corporate profits come under stress in a recession. I am not expecting more than a short-term rebound until we see clear evidence of looser liquidity.
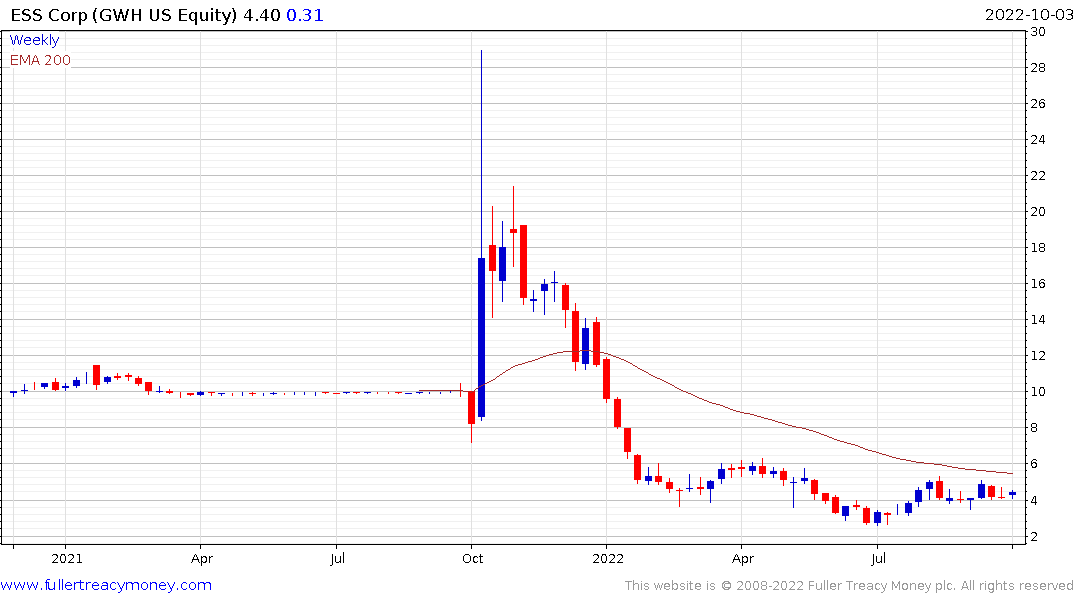
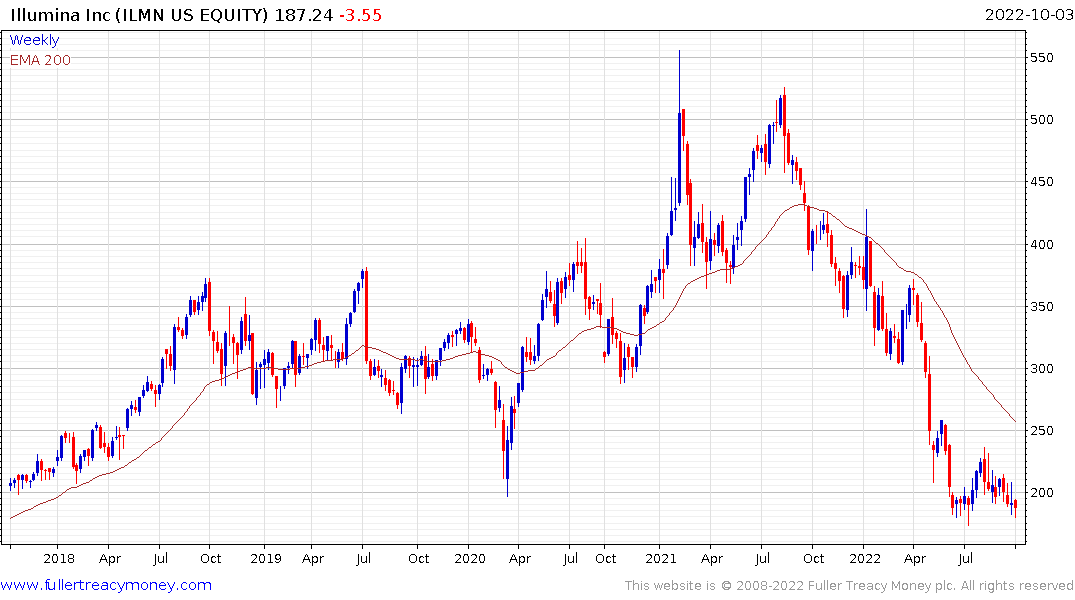
During my own click through this morning I was struck by how meagre the rebound was in dividend aristocrats, the relative strength of techie stocks with clearer narrative support like ESS Corp and Illumina and the strong follow through on gold and silver.
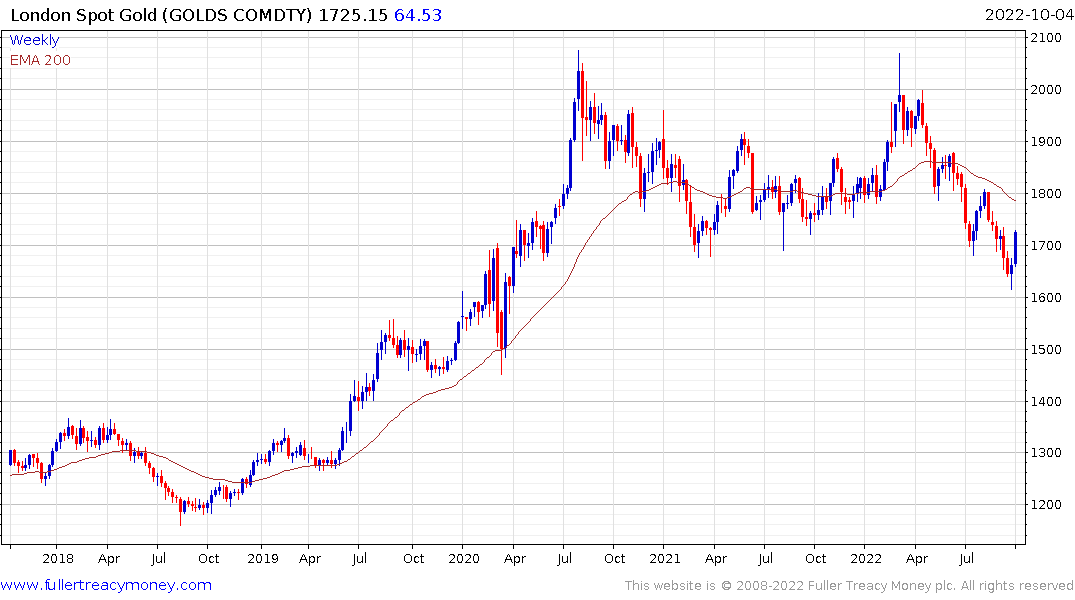
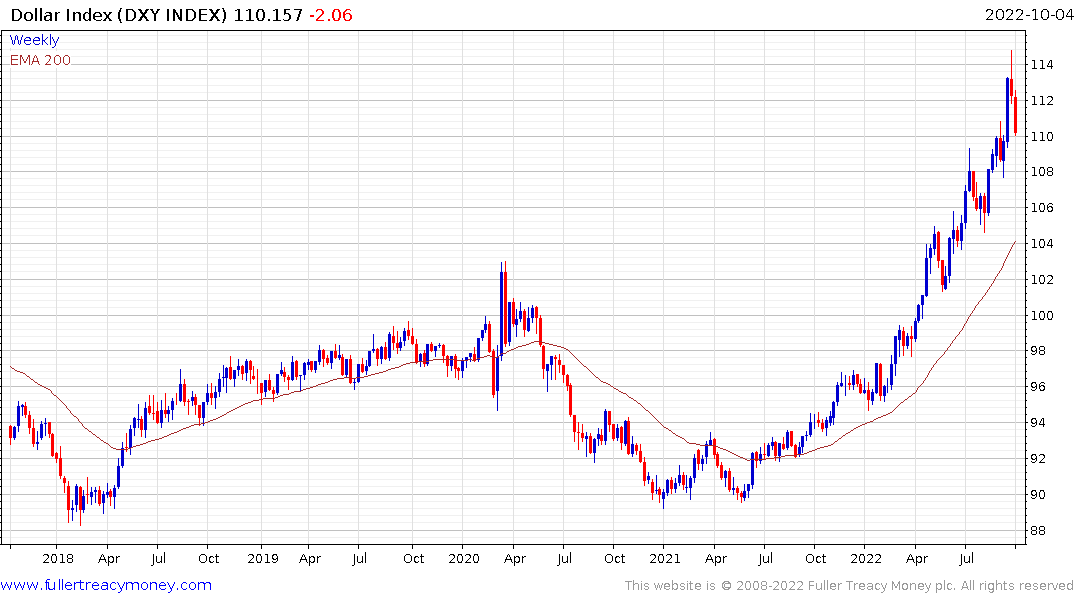
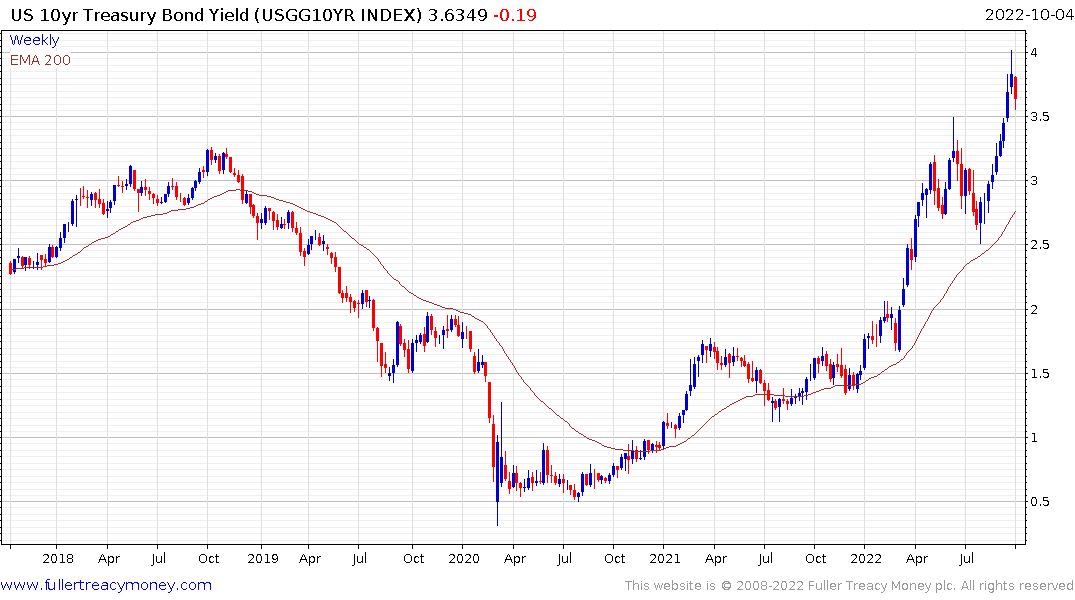
To me at least this suggests investors are not happy with the competitiveness of dividend yields versus Treasuries yet. They want to own growth stocks that will potentially prosper in a post tightening world and want to insure themselves against potential dollar weakness by owning precious metals.