
Commodities Roiled as Arctic Blast Takes Hold
This article by Robert Burgess for Bloomberg may be of interest to subscribers. Here is a section:
Prices for the heating fuel rose to the highest in a month as the U.S. burned the most natural gas ever on Monday, breaking a record set during the so-called polar vortex that blanketed the nation’s eastern half with arctic air in 2014, Bloomberg News reports. America consumed 143 billion cubic feet of gas as temperatures dipped to all-time lows on New Year’s Day, topping the previous high of 142 billion from four years ago, data from PointLogic Energy show. Ice in the Hudson River delayed fuel-barge deliveries, as the government warned of a home heating-fuel shortage from the East Coast to Texas. Natural gas prices have jumped 19 percent from a 10-month low on Dec. 21. U.S. retail diesel prices averaged $2.87 a gallon on New Year’s Day, the most since June 2015, according to AAA.

I drove up to Big Bear Lake Tuesday afternoon and there is no sign of the cold wracking other parts of the USA. Talk around town is much more about global warming and the shortening season because of the lack of snow. We took ski lessons this morning which is responsible for the late posting of Comment of the Day and the Subscriber’s audio for which I apologise.
Meanwhile the cold snap gripping the rest of the USA is driving demand for heating and the fact consumption is hitting new highs is a testament to both the economic recovery and the weather.
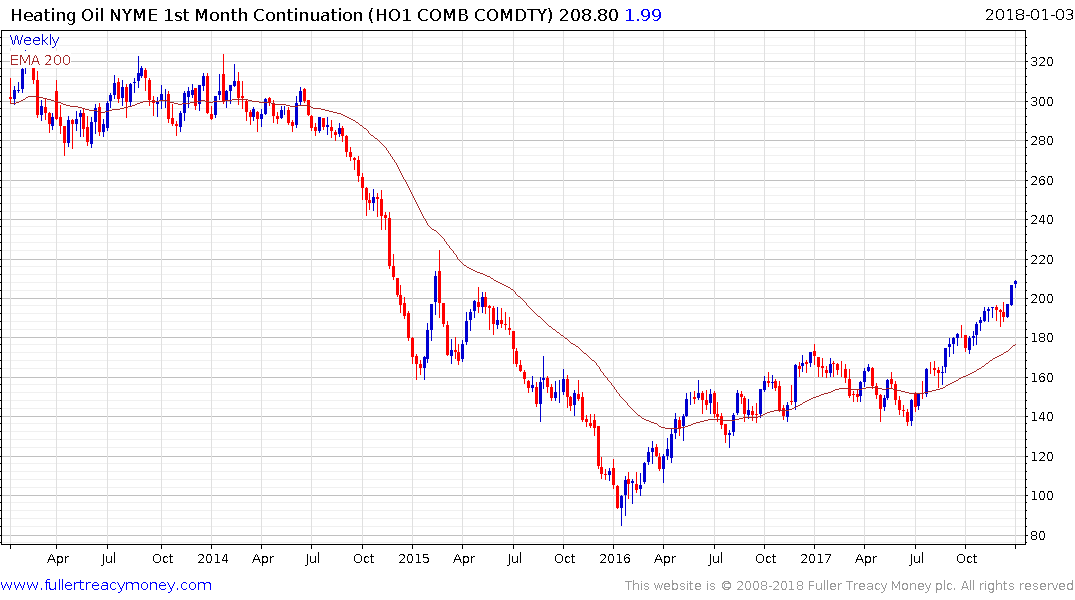
Heating oil has doubled since early 2016 and continues to trend higher in a consistent step sequence manner. A sustained move below 195 would be required to question the move.
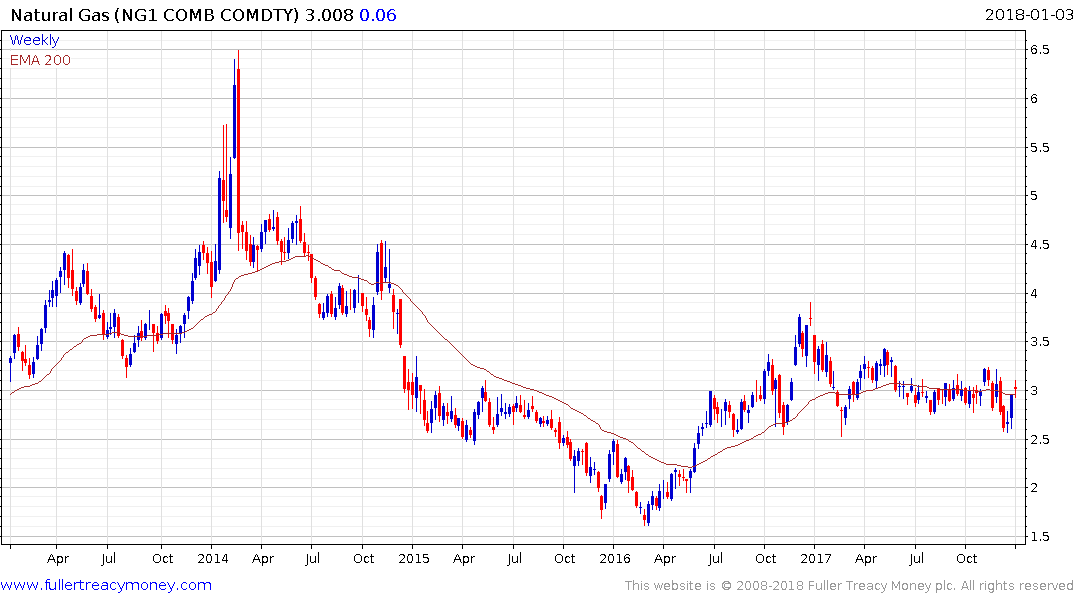
Natural Gas found support in the region of $2.60 last week which also marked the region of the February lows. It is now testing the $3 area and will need to hold the move above that level to confirm a return to demand dominance beyond short-term steadying.
The difference between the chart patterns is a reflection of the success of unconventional supply represented by shale gas.