
12 frightful slides before Halloween: Stocks boil and bubble, investors toil and trouble
Thanks to a subscriber for this report from Stifel which contains a number of insightful charts and may be of interest. Here is a section:

Here is a link to the full report and here is a section from it: .
If the recession ended Jun-2020, the S&P 500 has just delivered the second strongest post-recession rebound despite the weakest GDP track since WW2: The dichotomy between the S&P 500 and the economy is attributable to the increased prominence of large cap Tech and the positive effect of low real bond yields which magnify the valuation for those long duration stocks, but the cognitive dissonance of price versus recovery potential does appear stretched to us (Page 7)
Liquidity and the “Powell Pivot” in Dec-2018 have led to a P/E ratio boom (nascent bubble?) for long duration Tech stocks: Price and fundamentals are separate issues, so despite tech fundamentals perceived now as stronger than the late-1990s bubble, the price pattern is exactly the same: an “ascending curve,” with all the attendant risk and reward (Page 8)
Lesson for today? The 5 “high-tech” stocks in the 1972 Nifty Fifty saw their superior EPS offset by P/E compression 1973-82: We understand the view that tech leaders today are stronger in every respect than those of the late-1990s bubble, but a better comparison is the 1972 Nifty Fifty leaders, the post-script for which was that over-paying for growth with a Fed and Treasury determined to reflate in the next decade was not a good combination in 1972...nor do we believe it is now (Page 9)
The long-term charts contained in this report are helpful from the perspective of an investor either looking to monitor the potential for a bubble to evolve in the tech sector or the potential for cycles to rebound from depressed levels as a global recovery takes hold.
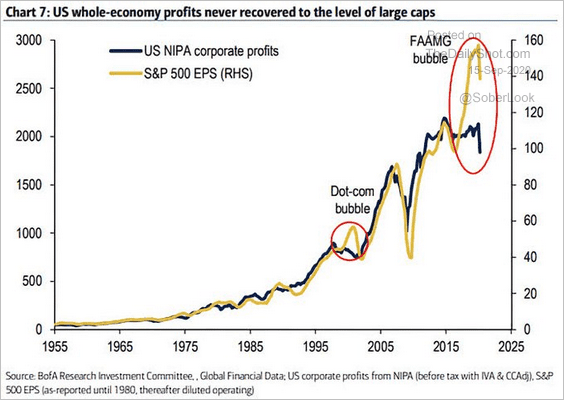
This long-term chart highlights the danger of divergences in EPS and profitability. If the bull market is to be sustainable over the long-term corporate profits are going to have to breakout and not just for a small number of companies. Without a more broad-based recovery we are certainly seeing a tech/private equity bubble inflating.
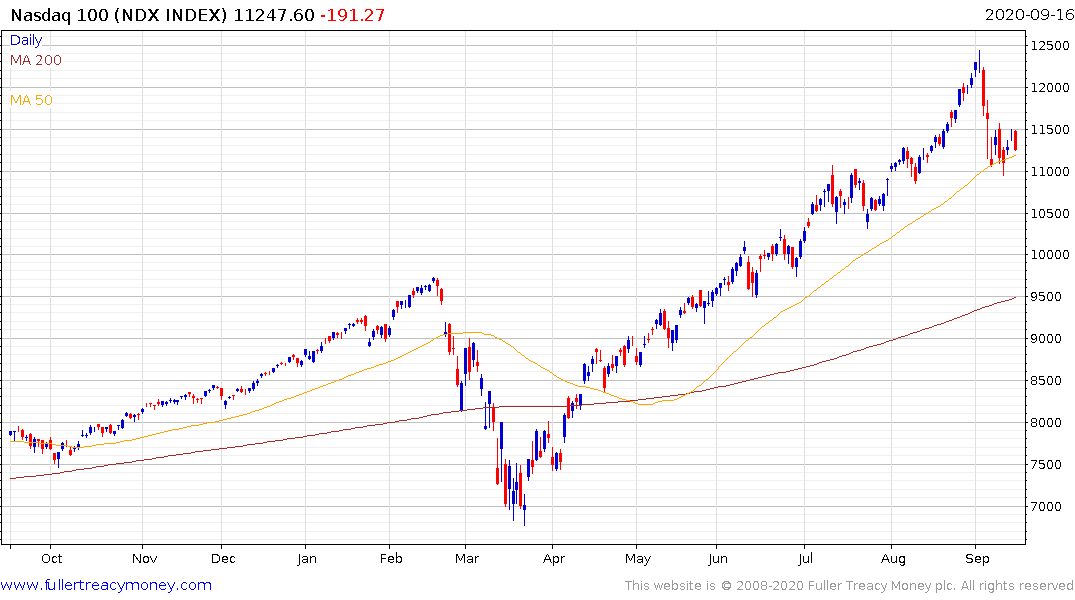
The Nasdaq-100 continues to pause in the region of the 50-day which is the first area of potential support. A failure at this level would question the sustainability of the momentum trade and would open up potential for a deeper and lengthier pullback.
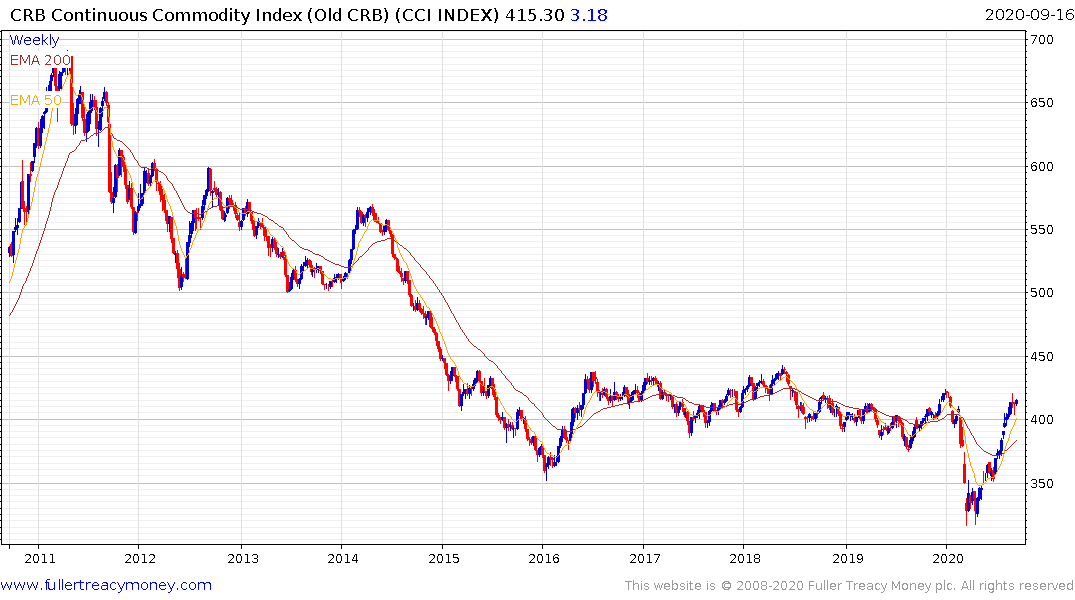
Meanwhile commodity prices, on aggregate are still relatively well contained but there is increasing evidence of base formation completion. That suggests 2021 is likely to be a year where commodities make a significant comeback.
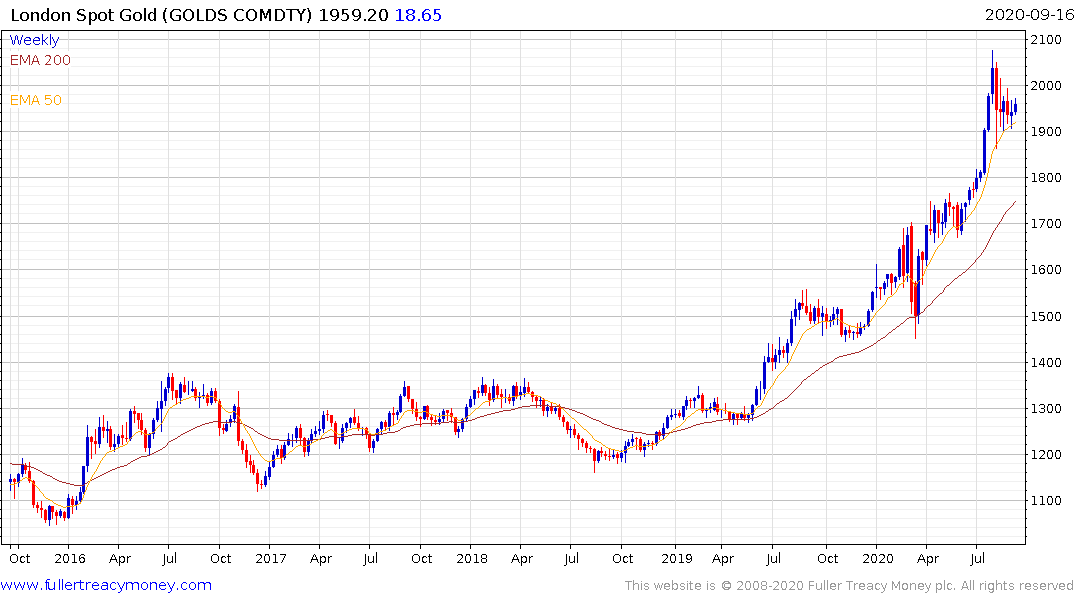
Gold continues to lead on the upside, even as it has paused over the last month to at least partially unwind the overextension relative to the trend mean.
The missing ingredient, so far, has been oil. There is a big secular argument about whether the oil price is even still relevant. Solar, wind and hydrogen are all now rallying without oil as a tailwind. That’s a big meaningful change. However, it is arguable whether the transition to renewables has progressed far enough to put a dent in oil demand without the ravages of the pandemic lockdowns to aid them.
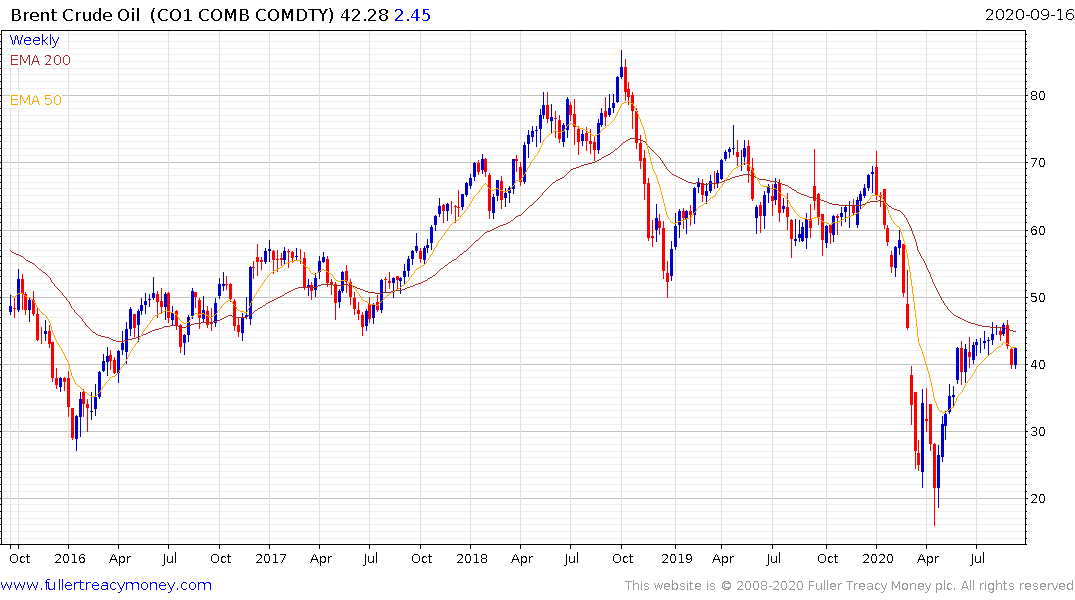
Brent crude rebounded from the $40 area today which confirms support at this psychological level. A sustained move back above the trend mean would bolster the recovery argument. Meanwhile oil producer shares have retraced most of the jump from the March lows. If oil continues to recovery this is one of the most unloved sectors anywhere.